|
|
|
- 傍静 苗
- 6 years ago
- Views:
Transcription

1 未标题 :21:45
2
3 Global Adult Tobacco Survey (GATS) China 2010 Country Report
4
5 Global Adult Tobacco Survey (GATS) China 2010 Country Report Consultants WangYu ChineseCenterforDiseaseControlandPrevention DouglasBettcher WorldHealthOrganization JonathanSamet UniversityofSouthernCalifornia JudithMackay WorldLungFoundation GaryGiovino StateUniversityofNewYorkatBuffalo JoBrickmayer CampaignforTobaccoFreeKids LubnaBhatti WorldHealthOrganization WangKean ThinkTankResearchCenterforHealthDevelopment WuYiqun ThinkTankResearchCenterforHealthDevelopment WangRuotao ChineseCenterforDiseaseControlandPrevention EditorinChief YangGonghuan ChineseCenterforDiseaseControlandPrevention Vice Editors in Chief JasonHsia YangYan U.S.CentersforDiseaseControlandPrevention ChineseCenterforDiseaseControlandPrevention Writers LiQiang XiaoLin ZhaoLuhua JeremyMorton WangCongxiao FengGuoze WuYanwei JiangYuan YangJie GanQuan WangJijiang ChineseCenterforDiseaseControlandPrevention ChineseCenterforDiseaseControlandPrevention U.S.CentersforDiseaseControlandPrevention U.S.CentersforDiseaseControlandPrevention ChineseCenterforDiseaseControlandPrevention ChineseCenterforDiseaseControlandPrevention WorldHealthOrganizationChinaOffice ChineseCenterforDiseaseControlandPrevention ChineseCenterforDiseaseControlandPrevention InternationalUnionagainstTuberculosisandLungDisease ChineseCenterforDiseaseControlandPrevention 1 iii
6 XieLi ChineseCenterforDiseaseControlandPrevention ZhangJian ChineseCenterforDiseaseControlandPrevention 2
7 Contributors Wegratefullyacknowledgethefollowingpeopleforcontributingtothisreport. GATSChinaWorkgroup: Dr.YangGonghuan,ChinaCDC:PrincipalInvestigator Dr.YangYan,NationalTobaccoControlOffice,ChinaCDC:LeaderoftheNationalWorkgroup Dr.LiQiang,NationalTobaccoControlOffice,ChinaCDC:Member Dr.XiaoLin,NationalTobaccoControlOffice,ChinaCDC:Member Dr.FengGuoze,NationalTobaccoControlOffice,ChinaCDC:Member Ms.WangCongxiao,NationalTobaccoControlOffice,ChinaCDC:Member Dr.WanXia,InstituteofBasicMedicalScience,ChineseAcademyofMedicalScience:Member Mr.LiYanfei,InformationCenter,ChinaCDC:ITrelatedsupport Mr.GeHui,InformationCenter,ChinaCDC:ITrelatedsupport Ms.BaoYidan,InformationCenter,ChinaCDC:ITrelatedsupport PartnerContributors: Dr.SamiraAsma,USCDC:Leadershipandextendingthepartnershipandsupport Dr.JasonHsia,USCDC:FocalpointforChinaandtechnicalguidanceandsupportduringallthe stagesofthesurvey Mr.LuhuaZhao,USCDC:Statisticalsupportduringtheanalysisandreportingofdata Dr.LindaAndes,USCDC:Statisticalsupportduringweightingdata Mr. Jeremy Morton, US CDC: Questionnaire Review Committee member and support during reportingofdata Dr. Gary Giovino, University of New York at Buffalo: Expert reviewer of the report and GATSQuestionnaireReviewCommitteeChairperson, Dr. William Kalsbeek, University of North Carolina at Chapel Hill: GATS Sample Review CommitteeChairperson Mr.JayLevinsohn,RTIInternational:ITrelatedsupport 3
8 Mr.SteveLitavecz,RTIInternational:ITrelatedsupport Mr.SameerPujari,WHO:ITrelatedsupport Ms.StephanieHess,USCDC:GATScoordinator Ms.AkikoWilson,USCDC:Graphicdesignsupport Mr.WilliamSpiers,USCDC:Graphicdesignsupport 4
9 Foreword Currently,nationsarestrivingtocurbtobaccouseandreduceitsharms.TheWorldHealth Organization s(who)frameworkconventionontobaccocontrol(fctc)andthempowerstrategies summarizetheworld smostuptodatetobaccocontrolexperiencesandprovideguidelinesfor effectivelypreventingandcontrollingtobaccouse. Theutilizationofresearchandsurveillance,andtheexchangeofinformationaredetailedin Article20oftheWHOFCTC,whichalsoexplainsthemeaningof M ( monitor )inthempower strategypackage.thefctcrequiresthatallpartiesestablishprogramsfornational,regionalandglobal surveillancetodeterminethemagnitude,patterns,determinantsandconsequencesoftobacco consumptionandexposuretotobaccosmoke.towardsthisend,thepartiesshouldintegratetobacco surveillanceintostandardizednational,regionalandglobalhealthsurveillancesothatdataare comparableandcanbeanalyzedatregionalandinternationallevels. TheChineseCenterforDiseaseControlandPrevention(ChinaCDC)wascommissionedin2008by theministryofhealthtoconductthe2010chinaglobaladulttobaccosurvey(gats).through systematicallymonitoringadulttobaccouse,thissurveytrackedkeyindicatorsfortobaccocontrolfrom anationallyrepresentativesampleandcollecteddataontheimplementationofthepolicies recommendedbythefctcandasindicatedinthempowerpackage. Chinaisthelargesttobaccoproducerandconsumerintheworld.Ithas1/5oftheworld's populationandishometo1/3oftheworld'ssmokers.thehealthhazardstothepublicandtheheavy socialandeconomicburdenscausedbysuchsubstantialtobaccoconsumptionareclear. China'stobaccocontroleffortsbegan30yearsago,asthecountrywasopeningupand undergoingreform.threenationwidesurveysandsurveillanceprogramsfocusingonthetobacco epidemicwereconductedinchina,in1984,1996and2002.theyhavesincebecomebenchmarksfor assessingtobaccouseinchinaandhaveservedasanimportantbasefordevelopingtobaccocontrol policies. Althoughimportantprogressandpartialbreakthroughshavebeenachieved,tobaccocontrol workisstillfacingsignificantdifficulties. 5

10 Chinahasaheavyresponsibilityandalongwaytogobeforeattainingcompletetobaccocontrol andfctccompliance.avarietyoflegislative,administrative,economicandpublicitymeasuresshould betakentopromotetheseefforts.however,thisgoalcannotbeachievedwithouttheawarenessand involvementoftheentiresociety. Letusworktogethertocreateasmokefreeenvironmentinordertoenjoylongandhealthylives! WangYu,M.D.,PhD, DirectorGeneral,ChineseCenterforDiseaseControland Prevention August6,2010 6
 China 2010 Country Report")
11 Global Adult Tobacco Survey (GATS) China 2010 Country Report 7 ix ix 成人烟草调查-中国报告--英文大替换-图形改编号后的 indd :56:15
12 Preface WHOwarmlycongratulatesChinaforthepublicationofthe GlobalAdultTobaccoSurvey(GATS) Report. TheGATS protocol is recognized around the world as international best practice and these results are reliable and scientifically defensible on epidemiological principles. By choosing to implement the GATS and executing it so effectively, China demonstrates that the value of health information is well understood and that the severity of the tobacco epidemic is appreciated by the Chinese authorities. In implementing GATS, China is setting an important good example for many othercountriestofollow. Epidemiologicalevidenceis of vital importance in formulating responsible, appropriate and effective responses to epidemics, be they emerging or long standing. Smarter ways of gathering, analyzingandusinghealthinformationleadtobetterdecisionsandspending,andmakeiteasiertotrack and confront threats to health and the economy. Thatis why this GATS Report is so important for China, where 301 million adults are smokers and therefore at high risk of disability and death from tobacco. Althoughmanypeoplethinkofanepidemicresponseintermsofcontaininginfectiousdisease outbreaks, China's longstanding high prevalence of tobacco addiction deserves the same level of concern as an outbreak of SARS or an H1N1 pandemic. Over the years, a combination of cultural factors,poorhealthliteracyandalackofappropriatelegislation,aswellaseconomicforcessurrounding thetobacco industry, haveresultedin epidemiclevels of tobacco addiction. Thisisparticularlytrue among Chinese men, among whom 52.9% are smokers. Tobacco use causes cancer, tuberculosis, chronic obstructive pulmonary disease and cardiovascular diseases. Childrenandothersexposed to secondhandsmokecansufferillnessandevendeathasaresult. Chronicconditionsnowconstitutethe lion'sshareoftheburdenofdiseaseinchina,andtobaccouseisthesinglelargestpreventablecauseof deathanddisease. China'sleadershiphasrecognizedthatthistobaccoepidemicmustbestoppedandthereforehas ratified the WHO Framework Convention on Tobacco Control. Full implementation of the proven measuresintheconventionwillbringdowntheprevalenceoftobaccouseinchinaandstopthecoming 8
13 wave of death and disability attributable to tobacco. WHO pledges to support China to urgently addressthetobaccoepidemic,toimprovethelivesofthechinesepeopleandtosafeguardtheeconomy fromthecostandproductivityimpactofchronicdisease.nowisthetimetofeedthenewdatafrom GATSintotheplanningprocesstoinformthefullimplementationoftheWHOFrameworkConvention ontobaccocontrol. WHO commends the Ministry of Health and the Chinese Center for Disease Control and Prevention on the success of GATS in this country, and appreciates the role of US CDC and other partners. WelookforwardtocontinuingourcollaborationtoimprovethelivesoftheChinesepeople. DrMichaelO'Leary WHORepresentativeinChina August 9,2010 9
14 Acknowledgements Chinabegan to honoritsfctccommitments in2006. Itwasessential to establishaneffective monitoring, supervising and evaluation system to monitor tobacco use and obtain nationally representativedataontobaccouse. The2010GlobalAdultTobaccoSurveyinChina(GATSChina)wascommissionedbytheMinistryof HealthofthePeople'sRepublicofChinaandimplementedbytheChineseCenterforDiseaseControl andprevention.preparationforthesurveybeganinoctober2008tocover100countiesin28provinces. Theprogramachieveddesirableresultsandaccumulatedusefulexperience.Itembodiestheeffortsand hardworkofmanypeople,towhomweexpressourheartfeltthanks! WethanktheBloombergInitiativetoReduceTobaccoUse,theBillandMelindaGatesFoundation, thecdcfoundationandwhofortheirfinancialandtechnicalsupport,whichmadethesurveypossible. WethanktheexpertsfromtheUnitedStatesCentersforDiseaseControlandPrevention(USCDC), who developed a set of systemic criteria for the adult tobacco use survey worldwide. We are appreciativeofalltheexpertsfromuscdcwhohaveprovidedguidanceandassistanceforgatschina. WethanktheleadershipoftheMinistryofHealthandtheChinaCDCfortheirstrongsupport. Ourthanksgotothenationalprojectofficeandprovincialsurveyteamsfortheirhardwork. WepaytributetoalltheeditorsandwritersofthisGATSChinaReport.Manyofthemhavebeen involved in the entire survey process and participated in the key work. They are the backbone and mainstayofthisprogram. Weappreciateallwhoworkedforandcontributedtheireffortstothisprogram. ThesuccessofGATSChinaindicatesthatasurveillancemethodandindicatorsfortobaccocontrol havebeensetup.itisnotonlyaglorytobecelebratedbyourchinesecolleagues,butalsoforusto sharewiththeworld! GATSChinaNationalOffice ChineseCenterforDiseaseControlandPrevention July26,
15 Executive Summary Itisessentialtoestablishaneffectivemonitoringandevaluationsystemtomonitortobaccouse and obtain nationally representative periodic data on the key indicators of tobacco use among adolescents and adults. This is a responsibility clearly given by the WHO Framework Convention on TobaccoControl(WHOFCTC)toallparties.TheWHOFCTCanditsguidelinesprovidethefoundationfor countries to implement and manage tobacco control.to help make this a reality, WHO introduced a package of measures, entitled MPOWER, that were intended to assist in the countrylevel implementation of selected measures to reduce the demand for tobacco, as contained in the WHO FCTC. The Global Adult Tobacco Survey (GATS) is a household survey coordinated by various internationalandnationalpartners.thebloomberginitiativetoreducetobaccouseandthebilland MelindaGatesFoundationprovidedresourcesandtheU.S.CentersforDiseaseControlandPrevention and WHO provided technical support. So far, 14 countries have implemented the survey, which has provided them with strong evidence for developing, monitoring, and implementing effective tobacco controls. The 2010 Global Adult Tobacco Survey in China (GATS China) was a nationally representative household survey of noninstitutionalized men and women aged 15 and older. The questionnaire elicitedinformationonbackgroundandcharacteristics,tobaccouse(smokingandsmokeless),cessation, secondhand smoke, economics, media, and knowledge, attitudes, and perceptions. Stratified multistageclustersamplingwasused.oneeligiblepersonwasrandomlyselectedfromeachselected household.theipaqhandheldcomputerswereusedtocollectdata.thehouseholdandtheindividual responserateswere97.5%and98.5%,respectively,andthetotalresponseratewas96.0%.atotalof 13,354peoplecompletedtheindividualquestionnaire. Themainresultswereasfollows: Tobacco use: The current smoking prevalence among people aged 15 and above was 28.1%, representing301millioncurrentsmokers.thecurrentsmokingprevalenceamongmenwas52.9%,and thatamongwomenwas2.4%;thecurrentsmokingprevalenceforthemalepopulationaged1569was 54.0%. The prevalence among male adults was higher in rural areas than in urban areas (56.1% vs. 49.2%).Mostofthecurrentsmokersweredailysmokers(85.6%)andsmokedmanufacturedcigarettes 11
16 (94.8%). Current smokers smoked 14.2 manufactured cigarettes a day on average. More than half of youngeverdailysmokers(2034years)becamedailysmokersbeforetheageof20. Therewasaslightdeclineinthecurrentsmokingprevalencecomparedtotheresultsofthe1996 NationalPrevalenceSurveyofSmokingPatterns,butitstillremainedatahighlevel. Nicotinedependenceandsmokingcessation:Amongeversmokers,16.9%hadquitsmokingand 11.7%hadquitfor2yearsorlonger,while36.4%ofcurrentsmokersandthosewhohadbeenabstinent forlessthanayearhadtriedtoquitsmokingintheprevious12months.however,91.8%ofthosewho hadtriedtoquitduringthepast12monthshadneverreceivedquittingassistance.amongthosewho hadrecentlyvisitedhealthcareproviders,33.9%receivedadviceonquittingsmoking.theproportionof relapsedsmokersamongeversmokerswashighat33.1%. Secondhand smoke exposure: Secondhand smoke exposure remained a serious issue. Among nonsmokers, 72.4% said they had been exposed to secondhand smoke and 38.0% said they were exposedtosecondhandsmokeonadailybasis. Itwasextremelycommonforrespondentstonoticesmoking(anindicatorofexposuretotobacco smoke) in indoor public places and at workplaces. The proportion of adults noticing smoking in restaurantswas88.5%,58.4%noticeditingovernmentbuildings,andaround35%inmedicalandhealth careinstitutions,inschools,andonpublictransportation.amongadultsaged15andolder,67.3%said tobaccosmokingoccurredathome. Amongrespondentswhoworkedindoors,37.7%reportedthattherewasnoruleagainstsmoking atworkand31.0%reportedthattherewasacompletebanonsmoking;89.2%ofthosewhoworked indoorsandreportedthattherewasnorestrictiononsmokingatworkplaceshadnoticedsmokingat workintheprevious30days.althoughtheprevalenceofexposuretosecondhandsmokewaslowerin workplaceswithacompletebanonsmoking,theproportionofadultswhohadnoticedsmokinginthose places was still as high as 25.5%. Overall, 63.3% reported smoking occurred at indoor workplaces. Therefore,protectionfromexposuretosecondhandsmokeinindoorpublicplacesandworkplaceswas notsufficientandsecondhandsmokeexposureremainedaveryserioushealthproblem. Economics:CigarettepricesinChinafollowedaskeweddistribution.Althoughsomerespondents reportedbuyingexpensivecigarettes,50%ofpeoplespentrmb5yuanorlessononepackofcigarettes. The median amount spent on 100 packs of manufactured cigarettes was only 2.0% of the 2009 per 12
17 capita Gross Domestic Product (GDP). Compared to other countries conducting the GATS, cigarette pricesinchinawereverylow. Warningandawarenessoftobacco sharms:intheprevious30days,40.2%ofadultsindicated theyhadnotseenanymessagewarningaboutthedangersoftobaccouseorencouragingsmokersto quit,eitherviathemediaorinpublicplaces.despitethefactthat86.7%ofcurrentsmokerssaidthey hadseenawarninglabelonacigarettepack( Smokingisharmfulforyourhealth )intheprevious30 days, 63.6% of them reported that the warning did not make them consider quitting. Currently, the healthwarningsonchinesecigarettepackagesdonotplayasufficientwarningandeducationalrole. Whilemostpeopleagreedthatsmokingandsecondhandsmokingwereharmfultohealth,theydidnot knowwhat thespecific health consequences were,suchasstroke,heartattackandlungcancer,and that secondhand smoke caused adult heart disease, lung cancer and lung diseases in children. More thanthreefourthsofadultsdidnotfullyunderstandtheharmsofsmokingandsecondhandsmoke,and there was even less understanding in rural areas. Among adults aged 15 and older, 35.8% did not correctly understand and 50.2% said they did not know (86.0% total) that the belief that lowtar cigarettes are less harmful than regular cigarettes has been proven to be erroneous. Health care professionals(54.7%),teachers,andthosewithmoreeducationhadhighlevelsofmisconceptions. Tobacco advertisement, promotion and sponsorship: Nearly one fifth of adults had noticed tobaccoadvertisementsorpromotionalactivitiesinthepast30days.amongadultswhohadnoticed tobacco advertisements or promotions during the past 30 days, 49.8% reported having noticed advertisementsontv. Conclusions:About301millionpeoplesmokeinChina.Currentsmokingprevalenceamongmenis amongthehighestintheworld.exposuretosecondhandsmokeisalsoveryhigh.thecurrentsmoking prevalence among men has remained at a high level. Most smokers (91.8%) who attempted to quit smoking had not received any cessation aids. Secondhand smoke exposure remained a very serious issueinindoorworkplaces,indoorpublicplacesandhomes.therewasalackofclearunderstandingof theharmsofsmokingandsecondhandsmoke.althoughmostadultsagreedthatsmokingwasharmful tohealth,theywerenotawareofthespecifichealthconsequences.ahighproportionofhealthcare professionals,teachersandotherhighlyeducatedpeoplebelievethatlowtarcigarettesarelessharmful. Tobaccocontrolmeasuresarepoorlyenforced. 13
18 Suggestions: It is vital to introduce mid and longterm plans for national tobacco control forthwith.thisshouldincludetheimplementationofwhofctcatthenational,regionalandlocallevel. Introducinglawsaddressingthepreventionand controloftobaccoharmsatthenationallevelwould providethelegalbasisfortobaccocontrolandimplementationofwhofctc,andincreasesintheretail priceoftobaccocouldpreventmanyyouthfromstartingtosmoke. 14
19 Definitions Eversmoker:Apersonwhohaseversmokedanytobaccoinhis/herlifetime. Currentsmoker:Apersonwhosmokedtobaccoatthetimeofinterview. Dailysmoker:Apersonwhosmokedatobaccoproductonadailybasisatthetimeofinterview. Formersmoker:Apersonwhosmokedtobaccointhepastbutwasnolongersmokingatthetimeof interview. Relapsedsmoker:Apersonwhohadquitsmokinginthepastbutwassmokingatthetimeofinterview. Eversmokingprevalence:Thepercentageofeversmokersinthetotalpopulation. Currentsmokingprevalence:Thepercentageofcurrentsmokersinthetotaladultpopulation. Dailysmokingprevalence:Thepercentageofdailysmokersinthetotaladultpopulation. Averagedailycigaretteconsumption:Theweightedaveragenumberofcigarettesacurrentsmoker smokedperday. Quitproportion:Thepercentageofformersmokersamongeversmokers. Relapseproportion:Thepercentageofrelapsedsmokersamongeversmokers. Quitratio:Thepercentageofformersmokersamongeverdailysmokers. Secondhandsmokeexposureprevalence:Thepercentageofadultnonsmokerswhowereexposedto secondhandsmokeforanytimeinadayandatleastonedayinatypicalweek. I
20 Contents Foreword by Wang Yu...5 Foreword by Thomas R. Frieden...7 Preface...8 Executive Summary...11 Definitions...Ⅰ Figures...Ⅳ Tables...Ⅶ 1. Introduction Methodology Survey Objectives Study population Eligibility criteria Sampling Design Questionnaire Data Collection Statistical Analysis Trend Analysis Sample and Population Characteristics Household and person level response rates Sample and population characteristics Tobacco Use Male current smoking prevalence in China remains at a high level Current smoking prevalence among different subgroups Average number of cigarettes smoked per day Age of daily smoking initiation decreased Trend analysis Nicotine Dependence and Cessation Half of the current daily smokers smoked within 30 minutes after waking The quit ratio among Chinese smokers was low compared to other countries Cessation aid...20 II
21 6. Secondhand smoke Exposure to secondhand smoke (SHS) was high Places of SHS exposure Lack of a smoking ban at the indoor workplace Economics Cost of purchasing cigarettes Expenditure on 100 packs of manufactured cigarettes as a percentage of 2009 GDP per capita Warning Labels and Knowledge and Perceptions of Tobacco Harm More than 40% of adults did not see anti-smoking messages % of current smokers who noticed the health warnings on cigarette packs during the past days didn t consider quitting More than three-fourths of adults are not fully aware of the health hazards of smoking Adults were unaware of the hazards of secondhand smoke Lack of knowledge of the hazards of low-tar cigarettes Tobacco Advertising, Sponsorhip, and Promotion About 20% of people noticed advertisements, promotions or sponsorships Diversified ways for tobacco advertisement, promotion and sponsorship Conclusions, discussions and suggestions Major conclusions The strengths and limitations of GATS China Suggestions...44 References...46 Appendix A: China GATS Questionnaire...48 Appendix B: Sample Design...83 Appendix C: Estimates of Sampling Errors...85 Appendix D: Technical and Survey Staff Appendix E: Glossary of Abbreviations III
22 Figures Figure4.1 Figure4.2 Figure4.3 Figure4.4 Figure4.5 Figure4.6 Figure5.1 Figure5.2 Figure6.1 Figure7.1 Figure8.1 Figure8.2 Figure8.3 Figure8.4 Figure8.5 Figure8.6 Figure8.7 Figure8.8 Figure9.1 Figure9.2 Currentsmokingrateamongadultmales15yearsoldinselectedGATS countries. Currentsmokingrateamongadults15to69yearsold,bygender,1996, 2002and2010. Trendofmalecurrentsmokingratebyagegroup. Trendoffemalecurrentsmokingratebyagegroup. Trendofcurrentsmokingrateamongadultmalesaged1569years from 1996to2010,byurban/ruralareas. Trendofcurrentsmokingrateamongadultmalesaged1569yearsinChina from1996to2010,byselectedoccupations. Percentagedistributionofdifferentstageofeversmokers(%),GATSChina PercentofformerdailysmokersamongeverdailysmokersinGATS countries. Percentageofadults15yearsoldwhonoticedsmokingatvariouspublic places,byresidence,gatschina2010. Chinesesmokersconsumingcigarettesatdifferentprices,2010. Percentageofadults15yearsoldwhoareawareofsmokingcauses diseases,byresidence,gatschina2010. Percentageofadults15yearsoldwhoareawareofsmokingcauses diseases,byeducation,gatschina2010. Percentageofadults15yearsoldwhoareawareofsmokingcauses diseases,byoccupation,gatschina2010. Percentageofadults15yearsoldwhoareawareofthehealthhazardsof secondhandsmokeexposure,byresidence,gatschina2010. Percentageofadults 15yearsoldwhoareawareofthehealthhazards ofsecondhandsmokeexposure,byeducation,gatschina2010. Percentageofadults15yearsoldwhoareawareofthehealthhazardsof secondhandsmokeexposure,byselectedoccupations,gatschina2010. Awarenessthatlowtarcigarettesareasharmfultohealthasregular cigarettes,byeducation,gatschina2010. Awarenessthatlowtarcigarettesareasharmfultohealthasregular cigarettes,byselectedoccupations,gatschina2010. Percentageofadults15yearsoldwhonoticedtobaccomarketing,by genderandresidence,gatschina,2010. Percentageofadults15yearsoldwhonoticedtobaccoadvertisingwho sawitondifferentsources,gatschina,2010. IV
23 Tables Table2.1 Table3.1 Table3.2 Table4.1 Table4.2 Table4.3 Table4.4 Table4.5 Table4.6 Table4.7 Table4.8 Table4.9 Table4.10 Table4.11 Table4.12 Table4.13 Table4.14 Summaryofthemethodologyofthe1996,2002,and2010surveys. Numberandpercentofhouseholdsandpersonsinterviewedandresponse ratesbyresidence(unweighted) GATSChina,2010. Distributionofadults15yearsoldbyselecteddemographiccharacteristics GATSChina,2010. Percentageandnumberofadults15yearsold,bydetailedsmokingstatus andgender GATSChina,2010. Percentageandnumberofcurrenttobaccosmokers 15yearsold,by detailedsmokingstatusandgender GATSChina,2010. Percentageandnumberofdailysmokersamongcurrenttobaccosmokers 15yearsold,byselecteddemographiccharacteristics GATSChina,2010. Percentageofcurrentsmokers 15yearsoldwhosmokeanycigarettes, andmanufacturedcigarettes,byselecteddemographiccharacteristics GATSChina,2010. Percentageofadults15yearsoldwhoarecurrentsmokersofvarious smokedtobaccoproducts,bygenderandselecteddemographic characteristics GATSChina,2010. Percentagedistributionofadults 15yearsold,bysmokingfrequency, genderandselecteddemographiccharacteristics GATSChina,2010. Percentageandnumberofadults15to69yearsold,bydetailedsmoking statusandgender GATSChina,2010. Numberofadults 15yearsoldwhoarecurrentsmokersofvarious smokedtobaccoproducts,bygenderandselecteddemographic characteristics GATSChina,2010. Numberofadults15to69yearsoldwhoarecurrentsmokersofvarious smokedtobaccoproducts,bygenderandselecteddemographic characteristics GATSChina,2010. Percentageofadults15to69yearsoldwhoarecurrentsmokersofvarious smokedtobaccoproducts,bygenderandselecteddemographic characteristics(1) GATSChina,2010. Percentageofadults15to69yearsoldwhoarecurrentsmokersofvarious smokedtobaccoproducts,bygenderandselecteddemographic characteristics(2) GATSChina,2010. Percentageofeversmokers15yearsoldwhoareformersmokers,and currentsmokers15yearsoldwhohavetriedtoquit,byselected demographiccharacteristics GATSChina,2010. Percentageofeversmokers 15yearsoldwhoareeversmokers,by selecteddemographiccharacteristics GATSChina,2010. Numberofeversmokers 15yearsoldwhoareeversmokers,byselected demographiccharacteristics GATSChina,2010. V
24 Table4.15 Table4.16 Table4.17 Table4.18 Table4.19 Table4.20 Table4.21 Table4.22 Table5.1 Table5.2 Table5.3 Table5.4 Table5.5 Table5.6 Table5.7 Table5.8 Table6.1 Percentageofeversmokers1569yearsoldwhoareeversmokers,by selecteddemographiccharacteristics GATSChina,2010. Numberofeversmokers1569yearsoldwhoareeversmokers,byselected demographiccharacteristics GATSChina,2010. Averageconsumptionperdayofmanufacturedcigarettesamong manufacturedcigarettesmokers15yearsold,byselecteddemographic characteristics GATSChina,2010. Percentagedistributionofdailycigarettesmokers15yearsold,by cigarettessmokedperday,genderandselecteddemographiccharacteristics GATSChina,2010. Meanageatdailysmokinginitiationamongcurrentdailycigarettesmokers byselecteddemographicvariables GATSChina,2010. Percentagedistributionofeverdailysmokers2034yearsoldbyageatdaily smokinginitiation,andselecteddemographicvariables GATSChina,2010. Averageageofdailysmokinginitiationamongeverdailysmokers2034 yearsold,byselecteddemographiccharacteristics GATSChina,2010. Currentsmokingrateamongadultsagedbetween15and69yearsin1996, 2002and2010. Percentagedistributionofdailysmokers15yearsold,bytimetofirst tobaccouseuponwakingandselecteddemographiccharacteristics GATS China,2010. Percentagedistributionofeversmokers15yearsold,bycurrentsmoking status,quittingstatus,andselecteddemographiccharacteristics GATS China,2010. Percentageofalladultsandeverdailysmokers 15yearsoldwhoare formerdailysmokers,byselecteddemographiccharacteristics GATSChina, Percentageofsmokers15yearsoldwhomadeaquitattempt,andwho receivedhealthcareprovideradviceinthepast12months,byselected demographiccharacteristics GATSChina,2010. Percentageofsmokers115yearsoldwhoattemptedtoquitsmokinginthe past12months,bycessationmethodsusedandselecteddemographic characteristics GATSChina,2010. Percentageandnumberofeversmokers 15yearsoldwhoquitsmoking2 yearsagoormore,bygenderandselecteddemographiccharacteristics GATSChina,2010. Weightednumberofeversmokers 15yearsold,byquittingstatusand selecteddemographiccharacteristics GATSChina,2010. Percentagedistributionofcurrentsmokers 15yearsoldbyinterestin quittingsmokingandselecteddemographiccharacteristics GATSChina, Percentageofadults 15yearsoldwhoareexposedtosecondhand smokinginatypicalweek,bysmokingstatusandselecteddemographic characteristics GATSChina,2010. VI
25 Table6.2 Table6.3 Table6.4 Table6.5 Table6.6 Table7.1 Table7.2 Table7.3 Table7.4 Table7.5 Table7.6 Table7.7 Table7.8 Table8.1 Table8.2 Table8.3 Percentageandnumberofadults15yearsoldwhoreportsmoking occurredinsidetheirhome,bysmokingstatusandselecteddemographic characteristics GATSChina,2010. Percentageandnumberofadults15yearsoldwhoworkindoorsnoticed smokingoccurredatworkplaces,bysmokingstatusandselected demographiccharacteristics GATSChina,2010. Percentageofadults 15yearsoldwhovisitedvariouspublicplacesinthe past30daysandwereawareoftobaccosmoke,bysmokingstatusand selecteddemographiccharacteristics GATSChina,2010. Percentagedistributionofadults15yearsold,byworkplacesmoking policy,andselecteddemographiccharacteristics GATSChina,2010. Percentageofadults15yearsoldwhoreportedsmokingoccurredintheir workplace,byworkplacesmokingpolicyandselecteddemographic characteristics GATSChina,2010. Medianamountspentper20manufacturedcigarettesamongmanufactured cigarettesmokers15yearsold,byselecteddemographiccharacteristics GATSChina,2010. Percentileofamountspentperpackofcigarettes,GATSChina2010 TransferpricesandretailpricesofdifferentclassesofcigarettesinChina, ChineseSmokersConsumingCigarettesofDifferentclasses,2010. Medianamountspenton100packsofmanufacturedcigarettesasa percentageofpercapitagdpamongcurrentmanufacturedcigarette smokers15yearsold,byselecteddemographiccharacteristics GATS China,2010. Percentagedistributionofcurrentmanufacturedcigarettesmokers15 yearsold,bylastbrandpurchasedandselecteddemographiccharacteristics GATSChina,2010. Percentagedistributionofmanufacturedcigarettesmokers15yearsold,by thesourceoflastpurchaseofcigarettesandselecteddemographic characteristics GATSChina,2010. Mediancigaretteexpenditurepermonthamongmanufacturedcigarette smokers15yearsold,byselecteddemographiccharacteristics GATS China,2010. Percentageofadults15yearsoldwhonoticedanticigarettesmoking informationduringthelast30daysinvariousplaces,bysmokingstatusand selecteddemographiccharacteristics GATSChina,2010. Percentageofcurrentsmokers 15yearsoldwhonoticedhealthwarnings oncigarettepackagesandconsideredquittingbecauseofthewarninglabels duringthelast30days,byselecteddemographiccharacteristics GATS China,2010. Percentageofadults15yearsoldwhobelievethatsmokingcausesserious illness,stroke,heartattack,orlungcancer,bysmokingstatusandselected demographiccharacteristics GATSChina,2010. VII
26 Table8.4 Table8.5 Table8.6 Table8.7 Table9.1 Table9.2 Table10.1 Percentageofadults15yearsoldwhobelievethatbreathingsmokefrom otherpeople scigarettescausesseriousillness,heartdiseasesinadults,lung diseaseinchildren,lungcancerinadultsbysmokingstatusandselected demographiccharacteristics GATSChina,2010. Percentageofadults15yearsoldwhoagree,disagree,orarenotsureif lowtarcigarettesarelessharmfulthangeneralcigarettes,bysmokingstatus andselecteddemographiccharacteristics GATSChina,2010. Percentageofcurrentsmokers15yearsoldwhonoticedhealthwarnings oncigarettepackagesandconsideredquittingbecauseofthewarninglabels duringthelast30days,byselecteddemographiccharacteristics GATS China,2010. Percentageofadults 15yearsoldwhonoticedanticigarettesmoking informationduringthelast30daysinvariousplacesamongwhonoticed anticigarettesmokinginformation,bysmokingstatusandselected demographiccharacteristics GATSChina,2010. Percentageofadults15yearsoldwhonoticedcigarettemarketingduring thelast30daysinvariousplaces,byselecteddemographiccharacteristics GATSChina,2010. Percentageofadults 15yearsoldwhonoticedcigarettemarketingduring thelast30daysinvariousplacesamongwhonoticedcigarettemarketing,by selecteddemographiccharacteristics GATSChina,2010. ImplementationstatusofWHOFCTCinChina(selectedmeasures)GATS China2010. VIII
27 1. Introduction Tobacco use is a major preventable cause of premature death and disease. Presently the total numberofsmokersintheworldisover1billion,aboutonefifthofthetotalpopulation.indeveloping countries,thenumberoftobaccousersissteadilyincreasingbecauseofthegrowingpopulationinthese countriesandthetobaccoindustry smarketingstrategies [1]. Tobaccousecausesover5milliondeathseachyearworldwide,anduptohalfofsmokerswilldie fromdiseasesattributabletotobaccouse [1].Unlesscurrenttrendschange,smokingisexpectedtocause over 8 million deaths yearly by By the end of this century, the total number of deaths due to tobacco use will reach one billion. Three fourths of those deaths are projected to occur in the developingworld [2]. Chinaistheworld slargestconsumeroftobacco,withanestimated301millionsmokers.thetotal number of deaths caused by tobacco use annually has been over 1 million. If current trends are maintained,thatnumberwouldrisetoover2millionby2030andto3millionby2050 [3]. To addresstheglobal tobaccoepidemic,the WorldHealth Organization (WHO) provided global policy leadership to promote its Framework Convention on Tobacco Control (WHO FCTC). The WHO FCTChadbeenratifiedby172countriesasof9December2010.InChina,theWHOFCTCwassignedby the government in 2003, approved by the National People s Congress (NPC) in 2005, and ratified on January 9, The WHO FCTC provides principles and frameworks for policy making, intervention planning,andpromotionofpoliticalandfinancialresources.article20ofthewhofctcrequiresthat Parties to the Convention establish, as appropriate, programs for national, regional and global surveillanceofthemagnitude,patterns,determinantsandconsequencesoftobaccoconsumptionand exposure to tobacco smoke. Towards this end, the Parties should integrate tobacco surveillance programsintonational,regionalandglobalhealthsurveillanceprogramssothatdataarecomparable andcanbeanalyzedattheregionalandinternationallevels,asappropriate [4]. TheWHOFrameworkConventionanditsguidelinesprovidethefoundationforcountriesto implementandmanagetobaccocontrol.tohelpmakethisareality,whointroducedthempower 1
28 packageofmeasurestoassistinthecountrylevelimplementationofselectedtobaccodemand reductionmeasures,ascontainedinthewhofctc.thesemeasuresinclude [1] : Monitortobaccouseandpreventionpolicies Protectpeoplefromtobaccosmoke Offerhelptoquittobaccouse Warnaboutthedangersoftobacco Enforcebansontobaccoadvertising,promotion,andsponsorship,and Raisetaxesontobacco. An efficient and systematic surveillance mechanism to monitor the epidemic is one of the essentialcomponentsofacomprehensivetobaccocontrolprogram.itisimportanttoobtaintobacco useindicatorsforyouthsandadultsperiodically,throughapopulationbased,nationallyrepresentative program. More than half of the world s countries lack uptodate nationally representative data [1]. Therefore,itisdifficulttomakecrosscountrycomparisons. InAugust2006,theWHOandtheUnitedStatesCentersforDiseaseControlandPrevention(US CDC)convenedanexpertconsultationtodiscussadulttobaccosurveillanceandmakerecommendations for the development of a standard survey protocol. The expert consultation also recognized the challenges of limited funding and methodological complexities when conducting systematic adult tobaccosurveys. The Bloomberg Initiative to Reduce Tobacco Use offered resources to fill the data gap for measuring adult tobacco use globally and to optimize the reach and results of the ongoing Global TobaccoSurveillanceSystem(GTSS),whichoriginallycomprisedofthreeschoolbasedsurveysforyouth andselectedadultpopulations:theglobalyouthtobaccosurvey(gyts),theglobalschoolpersonnel Survey(GSPS),andtheGlobalHealthProfessionsStudentsSurvey(GHPSS). TheGlobalAdultTobaccoSurvey(GATS)isahouseholdsurveythatwaslaunchedinFebruary2007 asanewcomponentoftheongoinggtss.gatswillenablecountriestocollectdataonkeytobacco controlmeasuresinthefulladultpopulation.resultsfromgatswillassistcountriesintheformulation, tracking and implementation of effective tobacco control interventions, and countries will be able to compareresultsoftheirsurveywithresultsfromothercountriesimplementinggats. 2
29 GATShasbeenimplementedinitiallyin14countrieswheremorethanhalfoftheworld ssmokers liveandthatbearthehighestburdenoftobaccouse:bangladesh,brazil,china,egypt,india,mexico, Philippines,Poland,theRussianFederation,Thailand,Turkey,Ukraine,UruguayandVietnam. TheUSCDC,theCDCFoundation,theJohnsHopkinsBloombergSchoolofPublicHealth(JHSPH), RTIInternational,andWHOareworkingwithcountriesthroughouttheworldtodesignandimplement GATS. HistoryoftobaccosurveillanceinChina Chinaconducteditsfirstnationaltobaccosurveyin1984 [5].In1996,theChinaCenterforDisease ControlandPrevention(formerlytheChineseAcademyofPreventiveMedicine)conductedtheNational Tobacco Epidemic Survey [6], the purpose of which was to monitor tobacco use, behaviors, and knowledgerelatedtotobaccouseinchina.thesurveyusedmultistagestratifiedprobabilitysamplesto represent Chinese residents aged 15 years and above. The sample size was 122,700. Indicators for measuringtobaccouseandexposuretosecondhandsmokeweredesignedandappliedinthesurvey, which became a benchmark for monitoring tobacco use in China. In 2002, behavioral risk factor surveillancewasconductedbythesameinstitute [7].Thesurveyusedthesamesampledesignasin1996 with a sample size of 16,056. In addition to tobacco use measures [8], the 2002 survey also included other risk factors, such as physical activity, nutrition, cancer screening, injuries, and knowledge and attitudes.boththe1996andthe2002surveysmaintainedhighqualitycontrolofthefieldwork.the surveysshowedthattheestimatedtotalnumberofcigarettesconsumedwasveryclosetothetobacco industry sreleaseddataoncigaretteproduction [9].Thesetwosurveysprovidedimportantevidencefor China stobaccocontrolpolicy. Since2002,smokingprevalencehasbeenreportedintheNationalHealthServicesSurveys(NHSS 2003 and 2008) [10, 11] and the Behavior Risk Factor Surveys (2004 and 2007) [12, 13]. However, these surveysincludedmuchbroadercontentsthanjusttobaccocontrolandthenumberofquestionsabout smokingwaslimited,thusmanykeytobaccocontrolindicatorsweremissed.forexample,nhssdidnot measure secondhand smoke exposure, and none of the surveys could be used to comprehensively evaluatetheimplementationofwhofctcinchina.chinahadratifiedwhofctcmorethan5years ago,andalargescaleepidemiologicsurveywasurgentlyneededtomonitortobaccouseandprevention policies. GATS China meets China s urgent needs and the results from GATS will be used tohelp the governmentofchinadesignandtailoreffectivetobaccocontrolpoliciesandprograms. 3
30 2. Methodology GATSChina2010wasacrosssectionalsurveydesignedtoproducenationalestimatesbygender and residence (urban/rural). This chapter focuses on the survey methodology, including study population,eligibilitycriteria,samplingdesign,questionnaire,datacollectionandstatisticalanalysis. 2.1 SurveyObjectives TheobjectivesofGATSaresystematicallytomonitoradulttobaccouse(smokingandsmokeless), trackkeytobaccocontrolindicatorsinanationallyrepresentativesampleofthechinesepopulation,and totrackimplementationofthewhofctcrecommendedpoliciesoutlinedinthempowerpackage. 2.2 Studypopulation The target population for the survey was defined as all Chinese residents, aged 15 and above, livingintheirprimaryresidencepriortothesurveydate,excludingthoselivinginstudentdormitories, militarybarracks,prisons,orhospitals. 2.3 Eligibilitycriteria Eligiblerespondentswereallnoninstitutionalizedpersonsaged15andoverwhoresidedinthe countryat thetimeofsurvey.foryoung respondentsaged15 17, parental orguardian consent was required.respondentswhoseprimaryplaceofresidencewasamilitarybaseorgroupquartersorwho were institutionalized (e.g., people residing in hospitals, prisons, nursing homes) were excluded. Moreover,selectedrespondentswereexcludediftheinterviewersdeterminedthattheywerelessthan 15yearsofageand/orwereincapacitated. 2.4 SamplingDesign A multistage stratified cluster sampling design was implemented in the survey (see details in Appendix B). The country was divided into six regions: North, Northeast, East, Central and South, Southwest, and Northwest. Each of the six regions was further divided into urban and rural areas, making 12 strata in total. At the first stage, urban districts or rural counties/countylevel cities were selected,usingtheprobabilityproportionatetosize(pps)samplingmethodfromthe2007household registration database administrated by the Ministry of Public Security of China. The measure of size (MOS)wasthenumberofhouseholds.Atthesecondstage,twourbanneighborhoodcommunitiesor ruralvillageswereselectedfromeachoftheselectedprimarysamplingunitsusingtheppsmethod.the 4
31 selected secondary sampling unit was partitioned into segments of around 1,000 households (using mappingandlistingtodeterminethenumber)andonesegmentwasrandomlyselected.atthethird stage,75householdswereselectedusingsimplerandomsamplingfromeachselectedsegment.atthe laststage,oneindividualwasrandomlyselectedfromeachparticipatinghouseholdusingsimplerandom sampling. 2.5 Questionnaire The China GATS Questionnaire added optional and countryspecific questions to the GATS core questionnaire (see details in Appendix A). The questionnaire included the following sections: background characteristics, tobacco smoking, smokeless tobacco, cessation, secondhand smoking, economics,media,andknowledge,attitudesandperceptions.thechinacenterfordiseasecontroland Prevention (China CDC) invited subject matter experts for three meetings to adapt the GATS questionnaire.theadaptedquestionnairewastranslatedandbacktranslatedtoensurethequalityof thetranslation.thequestionnairewasthenpretestedinthefieldinmay2009andaugust2009.based onthepretest,thequestionnairewasslightlymodifiedandfinalizedforfullstudyimplementation.the finalversionofthequestionnairewasapprovedbythegatsquestionnairereviewcommitteeinaugust DataCollection The implementing agency responsible for GATSChina data collection was Chinese Center for Disease Control and Prevention (China CDC). Eight full survey implementation training sessions were conducted. The training sessions took place in small groups and were given by the same trainers to ensurequality.allfieldinterviewersandcountycdcstaffattheprimarysampleunitlevelattendedthe trainingworkshops.fieldworktookplacefromdecember1,2009tomarch15,2010. There were 200 interviewers and 100 supervisors in the secondary sampling units. Two interviewersandonesupervisorwereassignedtoeachsecondarysamplingunit.thesupervisorwent with the interviewer to some of the households to ensure that the interviewer followed the survey guidelines.thesupervisoralsoreinterviewedabout10%ofhouseholdswithashorterversionofthe questionnaireasavalidationcheck.allproblemswerereportedtotheprovincialsupervisors.gatswas conducted in 28 of 32 provinces in China. Each province had one provinciallevel supervisor, who reportedtothenationalofficeifaproblemcouldnotbesolvedattheprovinciallevel.itstaffatthe 5
32 countylevelcdcofficetransferredthesurveydatafromipaqstolaptopsandsentthemtothenational officeweekly.thenationalofficesummarized the data and monitored data collection.thefinaldata cleaningwasconductedatthenationalofficeofthechinacdc. During the process of data collection, an interview would not be conducted if selected respondentsaged18andoverdidnotgivetheirverbalpermission.forrespondentsagedlessthan18 years, verbal consent must be obtained from both the respondents and their guardians before the survey.allcollecteddatawerekeptstrictlyconfidential. 2.7 StatisticalAnalysis Duetothecomplexsurveysampledesigninthestudy,SUDAAN10.0.1wasusedtocompute the estimates and proper standard errors of population parameters. SPSS 18.0 was used for sample weightinganddataqualityassurance. SampleweightsweredevelopedbytheU.S.CentersforDiseaseControlandPrevention.Each respondingunitwasassignedauniquesurveyweighttobeusedinthecalculationofsurveyestimates. The weighting process (see details in Appendix B) for GATS included three main steps: (1) the base weight or design weight, calculated from all steps of random selection in the sample design, (2) an adjustmentfornonresponsebysamplehouseholdsandsampleindividualseligibleforthesurvey,and (3)apoststratificationcalibrationadjustmentofsampletotalstoprojectthepopulationaged15years andabovebyregion,residence,genderandage. Thefinalweightassignedtoeachrespondentwascomputedastheproductofthebaseweight, thenonresponseadjustment,andpoststratificationcalibrationadjustment.thefinalweightwasused inallanalysestoproduceestimatesofpopulationparameters.allcomputationswereperformedusing thesudaancomplexsurveydataanalysisprocedure. 2.8 TrendAnalysis In this report, the GATS China 2010 data were compared to data from the 1996 National PrevalenceSurveyofSmokingPatternsandthe2002BehaviorRiskFactorSurvey.Althoughthesurveys didnothaveidenticalmethodologies,theydidhavemethodologicalsimilarities.first,thethreesurveys werealldesignedandconductedbychinacdc,thusallthequestionnairesusedsimilarquestionsand definitions, although some questions and definitions did change from 1996 to Second, the samplesofthethreesurveyswereallconsideredasnationallyrepresentative.third,allthreesurveys 6
33 had large sample sizes, resulting in relatively small sampling errors. Details of the three surveys are summarizedintable2.1. 7
34 3. Sample and Population Characteristics This chapter presents characteristics of the selected sample and the total population. The populationestimatesareweightedestimates,afterincorporatingpoststratificationadjustmentsbased on the projected population of China in 2008 by the National Bureau of Statistics. The data were stratifiedbyurbandistrictsandruralcountiesorcountylevelcities,andbygenderandagegroups. 3.1 Householdandpersonlevelresponserates The GATS China designated sample size was 15,000 households. After excluding ineligible households,13,562householdscompletedahouseholdinterview.table3.1presentsthenumberand percentage of household and personlevel interviews and response rates by residence. The overall household response rate was 97.5% 96.0% in urban districts and 98.8% in rural counties or countylevel cities. From each of the 13,562 households that completed a household interview, one person was selected for an individual interview. Among them, 13,354 individuals completed the personlevelinterview.theresponserateatintheindividuallevelwas98.5%98.3%inurbandistricts and98.6%inruralcountiesorcountylevelcities.theoverallresponseratewas96.0%(94.4%urbanand 97.4%rural). 3.2 Sampleandpopulationcharacteristics The13,354surveyedindividualsrepresentedapopulationof1,068,752,451menandwomenaged 15 years and older in China. Table 3.2 shows selected demographic characteristics of the weighted respondent data. There were 6,603 men and 6,751 women respondents, representing a target population of 50.9% men and 49.1% women. For age distribution, 5,000 and 5,001 individuals were interviewedinthe25to44and45to64agegroups,respectively.thenumberofrespondentsaged15 to24waslowerandthenumberofrespondentsaged65andabovewashigher.thiswasbecausemany youngpeople,particularlyinruralareas,didnotliveathomeduringthetimeperiodofthesurvey,and becauseofthesmalleragerange.theimbalancewasadjustedinpoststratification. By residence, 5,832 and 7,522 individuals were interviewed from urban and rural areas, respectively.theweightedpercentageestimateofpeopleinurbanareaswas46.1%,and53.9%inrural areas.thisindicatedatremendouschangeinurban/ruraldistributionsincetheyear2000.foreducation level,36.4%had attendedsecondary school,33.3%hadattendedprimaryschoolorless,18.8%were highschoolgraduates,and11.6%werecollegegraduatesorabove.occupationwasbasedondefinitions 8
35 providedbythenationalbureauofstatistics.31.6%wereagriculturalworkers,15.7%werebusinessor service employees, and 10.8% were machine operators. Worthy of note is the fact that 11.0% were unemployed, and 9.6% were retired. Also, only 1.7% were medical/health personnel, and 1.6% were teachingstaff,representingcloseto18millionand17millionpeople,respectively. 9
36 4. Tobacco Use Keyfindings: The smoking prevalence for men aged 15 and older in China was 52.9%, and the prevalenceformenaged1569yearswas54.0%. Amongeverdailysmokersaged2034years,52.7%hadstartedsmokingdailybefore theageof MalecurrentsmokingprevalenceinChinaremainsatahighlevel. The results of the GATS China survey indicated that the ever smoking prevalence was 33.5% among adults 15 years old and over, 62.8% among males, and 3.1% among females. The current smokingprevalencewas28.1%amongthetotaladultpopulation,52.9%amongmalesand2.4%among females.thedailysmokingprevalencewas24.1%amongthetotaladultpopulation,45.4%amongmales, and 2.0% among females. China has the most smokers in the world: 358 million ever smokers (342 millionmales and16millionfemales), 301million currentsmokers(288million males and13 million females),and257milliondailysmokers(247millionmalesand10millionfemales).seetable4.1for details. Among current smokers, 85.6% were daily smokers (85.7% for males and 83.0% for females) (Table4.2).Theproportionofdailysmokerswasloweramongsmokerswithahighereducationlevel (Table4.3).Thepercentageofdailysmokerswaslowest,at80.6%,amongsmokerswithacollegeor aboveeducation,comparedto88.2%amongsmokerswithaprimaryschoolorlesseducation.among current smokers, 94.8% smoked manufactured cigarettes. The percentages of current smokers who smoked manufactured cigarettes were generally over 90%, with exceptions observed among female smokers(80.5%),people65yearsandolder(78.6%),andthosewithprimaryschoolorlesseducation (83.6%).DetailsareshowninTable4.4. Thecurrentsmokingprevalenceamongadultmalesisoneofthehighestintheworld [1].Figure4.1 showsthecurrentsmokingprevalenceamongadultmalesincountriesthatcompletedthegatssurvey, amongwhichchina scurrentsmokingprevalencewasthesecondhighest. 10

37 4.2 Currentsmokingprevalenceamongdifferentsubgroups Malesaged4564yearshadthehighestsmokingprevalence Current smoking prevalence varied across different age groups. Among males, the current smoking prevalence was 63.0% in the 4564 age group and 59.3% in the 2544 age group. Female current smoking prevalence increased with age. The highest smoking prevalence among females was amongthoseaged65andabove,at6.7%.seetable4.5fordetails. 11
38 Currentsmokingprevalencewaslowestamongthosewithacollegeoraboveeducation Currentsmokingprevalencediffereddramaticallyamonggroupswithdifferenteducationlevels. Amongthosewiththehighesteducation,currentsmokingprevalencewaslowest.Thehighestcurrent smoking prevalence among males was 63.2%, for those with a secondary school education and the lowestcurrentsmokingprevalenceamongmaleswas44.0%,forthosewithacollegeoraboveeducation. Amongfemales,thecurrentsmokingprevalencewaslowestforthosewithacollegeoraboveeducation, at0.6%,and4.3%forthosewithaprimaryschoolorlesseducation.detailsareshownintable4.5. Ruralmaleshadhighercurrentsmokingprevalencethanurbanmales The current smoking prevalence was 56.1% among rural males and 49.2% among urban males. Current smoking prevalence among urban and rural females were 2.6% and 2.2%, respectively. See Table4.5fordetails. Currentsmokingprevalencewashighestamongmalesinthewestregion ThecurrentsmokingprevalencewashighestamongmalesintheWestregionat59.2%,compared to48.7% among malesinthe Eastregion and51.4%amongmalesinthecentralregion.the current smokingprevalencewashighestamongfemalesinthecentralregionat4.1%,comparedto1.5%among femalesintheeastregionand2.0%amongfemalesinthewestregion.detailsareshownintable4.5. Currentsmokingprevalencewerehighestformachineoperatorsandagriculturalworkers Current smoking prevalence among males was highest for machine operators and agricultural workers, at 67.0% and 60.4%, respectively, followed by leaders of organizations at 54.1%. Current smokingprevalenceamongmalemedicalprofessionalsandteacherswaslowest,at40.4%and36.5%, respectively. Overall, the female smoking prevalence was 2.4%. It is worth noting that the current smokingprevalenceamongfemaleleadersoforganizationswas4.1%.seetable4.5fordetails. Otherdataofsmokingprevalenceandnumberofsmokersareshowintables4.6to Averagenumberofcigarettessmokedperday Onaverage,cigarettesmokerssmoked14.2manufacturedcigarettesperday14.3amongmale smokers and 10.6 among female smokers (Table 4.6). Different age groups of smokers consumed differentamountsofcigarettesperday.amongmalesmokers,averageconsumptionofmanufactured cigarettesperdaywaslowestamongthoseaged1524,at10.0,andhighestamongthoseaged4564,at 12
39 16.9. Among female smokers, average consumption of manufactured cigarettes per day was lowest amongthoseaged1524,at6.4,andhighestamongthoseaged65yearsandover,at11.5. Amongmalecurrentsmokers,averagedailyconsumptionofmanufacturedcigarettesdecreased with increased education. On average, smokers with primary school or less education smoked 16.1 cigarettesperday,comparedto12.7amongsmokerswhohadgraduatedfromcollege. By occupation, the consumption of manufactured cigarettes per day was relatively high among agriculturalworkers,at15.6.maleteachersandhealthpersonnelconsumedanaverageof13.0and12.4 cigarettesperday,respectively.detailsareshownintable4.17. Further analysis indicated that 44.6% of the manufactured cigarette smokers consumed 1524 manufactured cigarettes per day; only 5.3% consumed fewer than 5 cigarettes per day on average. There was not much difference across residence types and occupation groups. See Table 4.18 for details. Theaveragenumberofcigarettessmokedperdayin2010wasclosetothatobservedinthe1996 and2002surveys. 4.4 Halfofdailysmokersaged2034yearsstarteddailysmokingbeforetheageof20 Table4.19providesthemeanageofdailysmokinginitiationacrossagegroups.Becausethe2034 agegroupbestreflectsthemostrecenttrendsinageofdailysmokinginitiation,distributionofageat dailysmokinginitiationwascalculatedforthisagegroup.amongeverdailysmokers2034yearsold, 52.7%starteddailysmokingbeforetheageof20.DetailsareshowninTable4.20, Trendanalysis MalecurrentsmokingprevalenceinChinaremainsatahighlevel Comparedwiththeresultsfromthe1996and2002surveys [8],thecurrentsmokingprevalence amongmalesaged1569yearshaddecreasedslightlybutstillremainedatahighlevel(figure4.2). Usingthe2000NationalPopulationCensusofChinaasthestandardpopulationfordifferentage groups,standardizedcurrentsmokingprevalenceamongchineseadultswascomputedin1996,2002, and2010.thestandardizedcurrentsmokingprevalenceamongadultsagedbetween15and69years was33.7%in1996,28.5%in2002,and27.9%in2010.from1996to2002,thestandardizedcurrent 13
40 smokingprevalencedecreasedby0.87%peryear,whilefrom2002to2010,thestandardizedcurrent smokingprevalencedecreasedbyonly0.08%peryear(table4.22). Sources:Datainfigure4.2comefromthe1996NationalPrevalenceSurveyofSmokingPattern,the 2002BehaviorRiskFactorSurvey,andGATSChina,2010. Trendsincurrentsmokingprevalenceamongdifferentagegroups Asshowninfigure4.5a,from1996to2002,currentsmokingprevalenceamongthefollowingage groupsdecreased:malesaged2529,3034,3539,4044,4549,5559,6569,andfemalesaged5559, 6064,6569;whilefrom2002to2010,exceptformalesaged4059,currentsmokingprevalenceamong otheragegroupsdidnotchangesignificantly.seefigures4.3and4.4fordetails

41 Global Adult Tobacco Survey (GATS) China 2010 Country Report Sources: Data in figures 4.3 and 4.4 come from the 1996 National Prevalence Survey of Smoking Pattern, the 2002 Behavior Risk Factor Survey, and GATS China, Note: The scale of the vertical axis in Figure 4.4 is different from Figure 4.3. The seemingly larger differences between female smoking prevalence in 1996, 2002, and 2010 are partly due to the differences in scales. 16 成人烟草调查-中国报告--英文大替换-图形改编号后的 indd :56:39


42 Trendsincurrentsmokingprevalenceamongmalesbyurban/ruralareasandoccupations Figure4.5showsthetrendofcurrentsmokingprevalenceamongadultmalesinChinafrom1996to 2010,byurban/ruralareas.Inbothurbanandruralareas,thecurrentsmokingprevalenceamongadult malessignificantlydecreasedfrom1996to2002,butremainedunchangedfrom2002to2010. Sources:Datainfigure4.5comefromthe1996NationalPrevalenceSurveyofSmokingPattern, the2002behaviorriskfactorsurvey,andgatschina,2010. Figure4.6showsthetrendofthecurrentsmokingprevalenceamongadultmalesinChinafrom 1996to2010,byselectedoccupationalgroups.Amongmaleteachersandmedical/healthpersonnel,the currentsmokingprevalenceshowedadecreasingtrend.currentsmokingprevalenceamongmalesin otheroccupationalgroups,particularlymachineoperators,agriculturalworkers,andleadersof organizations,werecloseto2002levels. 16

43 Sources:Datainfigure4.6comefromthe1996NationalPrevalenceSurveyofSmokingPattern,the 2002BehaviorRiskFactorSurvey,andGATSChina,
44 5. Nicotine Dependence and Cessation KeyFindings: Half of daily smokers smoked within 30 minutes after waking. The proportion of relapsed smokersamongeversmokerswas33.1%,whichwassimilarto2002results. 16.9%ofeversmokershadalreadyquit;11.7%ofeversmokershadquitfor2yearsormore. Duringthepast12months: 36.4%ofsmokershadattemptedtoquitsmoking;91.8%ofthosedidnotuseanycessation method,includingpharmacotherapymedicationsandcounseling. Only33.9%ofsmokerswhohadvisitedahealthcareproviderreceivedcessationadvice. 5.1 Halfofthecurrentdailysmokerssmokedwithin30minutesafterwaking The time between waking and first smoking of tobacco can be used as a measure of nicotine dependence. Generallyspeaking,theshorter thetimebetweenwakingand smoking,theheavierthe nicotinedependence.gatsshowedthat50.3%ofcurrentdailysmokerssmokedwithin30minutesafter waking.nicotinedependencewasmostlikelyamongdailysmokersaged4564,where58.2%smoked within30minutesand31.0%smokedwithin5minutesofwaking.detaileddataareshownintable ThequitratioamongChinesesmokerswaslowcomparedtoothercountries Aseriesofquestionswereusedtomeasurethedesiretoquitsmokingorpastcessationbehaviors among ever smokers. All ever smokers were classified into four categories: 1) former smokers, 2) relapsedsmokers(currentsmokerswhotriedtoquitinthepast),3)currentsmokerswhohadnever triedtoquitbutplannedtoquit,and4)currentsmokerswhohadnevertriedtoquitanddidnotplanto quit. Amongeversmokers,thenumberofformersmokersinthepopulationwasestimatedtobe57.5 million(16.9%)andthenumberofrelapsedsmokerswas112.8million(33.1%),whereas17.3million smokers (5.1%) planned to quit smoking, and million smokers (44.9%) had no plans to quit smoking(seefigure5.1).seetable5.2forfurtherdetails.amongeversmokers,11.7%hadquitfortwo yearsormore. 18


45 Global Adult Tobacco Survey (GATS) China 2010 Country Report GATSGATS ChinaChina Report Report Because daily smokers are are more addicted and and cessation is more difficult for for them than for for Because daily smokers more addicted cessation is more difficult them than occasional smokers, the the proportion of former smokers among ever daily smokers was was calculated to to occasional smokers, proportion of former smokers among ever daily smokers calculated further measure the the cessation level of smokers. This This proportion is also called the the quit quit ratio for for daily further measure cessation level of smokers. proportion is also called ratio daily smoking. The quit ratio among ever daily smokers was 12.8% (Table 5.3), which was the second lowest smoking. The quit ratio among ever daily smokers was 12.8% (Table 5.3), which was the second lowest among all GATS countries that released the GATS results (see Figure 5.2). among all GATS countries that released the GATS results (see Figure 5.2). Note: Among countries having released the GATS results. Note: Among countries having released the GATS results. Source: Data in figure 5.2 come from the GATS country reports. Source: Data in figure 5.2 come from the GATS country reports 成人烟草调查-中国报告--英文大替换-图形改编号后的 indd :56:42
46 Source:Datainfigure5.2bcomefromtheGATScountryreports. 5.3 Cessationaid Cessationisacomplicatedprocessaffectedbymanyfactors.Theenvironment,includinghelpand advicefromhealthcareprofessionals,hasanenormousinfluenceonsmokers desiretoquit,cessation behaviors,and successful quitting.anotherfactorthataffects successfulcessationismethodusedto quitsmoking.pharmacotherapymedicationandcounselingincreasethelikelihoodofsuccessfulquitting; in contrast, if the above methods are not used and smokers only rely on their own will power, the prevalenceofsuccessfulquittingmayberelativelylower. Cessationaidprovidedbyhealthcareprofessionals Smokingisaddictiveandcessationisnoteasy.Cessationaidscansignificantlyboostquitrate.Stop smokingmedications,includingnicotinepatch,nicotinegum,zyban,andvareniclinewereavailableon themarketinchinain2010.alltheabovemedicationsarenotcoveredbyhealthinsurance.therewas one cessation hotline in China in 2010; however, it was not a tollfree number and the service was providedonlyonthedaytimeofworkdays. Table5.4showsthequitattemptsandcessationaidseekingbehaviorsamongsmokersduringthe previous 12 months, including smokers attempts to quit smoking during the previous 12 months, whether smokers had seen physicians during the previous 12 months, whether smokers were asked abouttheirsmokingstatuswhenseeingaphysician,whethersmokersreceivedcessationadvicefrom physicians,andwhethersmokerswhoattemptedtoquitsmokingduringtheprevious12monthshad received cessation advice from physicians. Among current smokers and smokers who quit during the previous 12 months, 36.4% had attempted to quit smoking during the previous 12 months. Among smokerswhovisitedahealthcareproviderduringtheprevious12months,40.8%wereaskedifthey smokedand33.9%receivedcessationadvice.inotherwords,60%ofcurrentsmokerswerenotasked abouttheirsmokingstatuswhenseeingphysicians,andalmost70%didnotgetcessationadvice.the percentageofcurrentsmokerslessthan45yearsoldwhoreceivedcessationadvicewaslower,at24.8%, andthepercentageamongcurrentsmokersagedbetween15and24yearswasespeciallylow. Thedifferencesintheprovisionofcessationguidancebyhealthprofessionalsweresmallbetween urbanandruralareasandamongdifferentregions(east,central,andwest). 20
47 Amongcurrentsmokersandrecentformersmokerswhohadattemptedtoquitduringthepast12 months,43.4%receivedcessationadvicefromhealthprofessionals. Cessationmethodsusedbysmokerswhoattemptedtoquitsmoking Table5.5showsthecessationmethodsusedbysmokerswhohadattemptedtoquitduringthe previous12months.theproportionsofthoseusingsmokingcessationmedicationsandcounselingwere verylow,at3.1%and3.0%,respectively.91.8%didnotuseanyspecialcessationmethods. 21
48 6. Secondhand smoke KeyFindings: Prevalenceofexposuretosecondhandsmokewashigh;72.4%ofnonsmokerswereexposed tosecondhandsmoke. Smokingwasreportedtooccurin67.3%ofhomes. 88.5% of people had noticed smoking in restaurants, 58.4% in government buildings, and around 35% in each of the following places: health care facilities, schools, and public transportation. 31.0% of people who worked indoors reported that there was a complete ban against smokingintheworkplace,andofthosepeople,25.5%stillnoticedsmokingintheworkplace. 6.1 Exposuretosecondhandsmoke(SHS)washigh The method of asking about exposure to SHS was similar to that used in previous surveys.respondentswereaskedabouttheiroverallexposuretoshsinatypicalweek.a totalof72.4%ofnonsmokersreportedbeingexposedtoshsand38.0%ofnonsmokerssaid theywereexposedtoshsalmosteveryday.basedontheaboveexposureprevalence,an estimated556millionnonsmokingadultswereexposedtoshsatleastonedayinatypical week. The SHS exposure prevalence was around 53% in the 1996 and 2002 surveys. The differencemaybeexplainedbythefactthatinthe1996and2002surveys,exposurewas definedasatleast15minutesperday,butgatschinadidnotlimitthetimeofexposureper day. Consequently, the results in this survey may be higher than those found in previous surveys. Exposure to SHS was especially high among leaders of organizations (85.8%), and businessandserviceemployees(83.1%).detailsforotheroccupationsareprovidedintable 6.1. TherewasnosignificantdifferencebetweentheprevalenceofexposuretoSHSamong men (74.1%) and women (71.6%). SHS exposure for nonsmokers in rural and urban areas was74.2%and70.5%,respectively,withnosignificantdifferencebetweenthem. 6.2 PlacesofSHSexposure To measure SHS exposure in specific places, respondents were asked if someone smokedintheirhouseholdsandpublicplacestheyhadvisitedinthelast30dayspriortothe 22
49 interview.respondentsworkingindoorswereaskedifsomeonesmokedintheirworkplace intheprevious30days.inthe1996and2002surveys,thehouseholdwasthemostcommon placeforsecondhandsmokeexposure,followedbypublicplacesandworkplaces.however, theproportionofnoticingsomeonesmokinginpublicplaceswashigherthaninhouseholds andindoorworkplacesinthegatschinasurvey. Household Thesurveyresultsshowedthat67.3%ofallrespondentsreportedsomeonesmokedin theirownhomes.theproportionwas63.9%forwomen,and70.5%formen;73.4%of respondentsinruralareasreportedsomeonesmokedintheirhomes,whichwashigherthan the60.0%inurbancities. Peoplewithdifferenteducationallevelsreporteddifferentpercentagesofsmokingat home.thepercentagesforadultswithprimaryandsecondaryschooleducationwere68.9% and71.5%;followedbyhighschoolgraduatesat62.5%;collegegraduatesorabovereported thelowestpercentageofshsexposureintheirhomes(51.7%).seedetailsintable6.2 Indoorworkplaces Thepercentageofpeopleworkinginindoorlocationnoticingsomeonesmokedintheir workplaceswas63.3%,71.1%formalesand53.2%forfemales. Thepercentagesofpeoplewithdifferentoccupationsworkingindoorsreportinghaving noticedsmokingweredifferent.thepercentagewasover70%amongagricultureworkers (78.5%),leadersoforganizations(73.2%),andbusinessorserviceemployees(71.8%);60%to 70%amongspecializedtechnicians(66.3%),machineoperators(61.6%)andclerks(64.9%); andlessthan60%amongmedical/healthpersonnel(55.4%)andteachingstaff(54.8%).see detailsintable6.3 Publicplaces The results for exposure to SHS in public places varied by location. The highest proportionofrespondentsnoticingsomeonesmokingwasinrestaurants(88.5%),followed bygovernmentbuildingsat58.4%.theproportionsforotherpublicplaceswereasfollows: 37.9%inhealthcarefacilities,36.9%inschools,and34.1%onpublictransportation.There wasnosignificantdifferencebetweentheproportionsofpeoplenoticingsmokingbetween urbanandruralareas(figure6.1).seedetailsintable

50 Note:Amongthosewhohadvisitedthepublicplacesduringthepast30dayspriortothesurvey 6.3 Lackofasmokingbanattheindoorworkplace Toassessinformationonsmokefreepolicesandrulesatworkplaces,respondentswere asked Which of the following best describes the indoor smoking policy where you work: Smokingisallowedanywhere,smokingisallowedonlyinsomeindoorareas,smokingisnot allowedinanyindoorareas,orthereisnopolicy? and Duringthepast30days,didanyone smokeinindoorareaswhereyouwork? Amongthosewhoworkedindoors,37.7%reported that there was no policy on smoking indoors at the workplace, while 31.0% reported a completebanonindoorsmoking. Thesmokefreepolicyvariedbetweenoccupations:48.1%ofhealth/medicalpersonnel and41.8%ofteachingstaffreportedsmokingwasnotallowedintheirindoorworkplaces, while 15.3% of health/medical personnel and 21.7% of teaching staff reported that there were no rules or restrictions of smoking in their workplaces. Only 25.5% of leaders of organizations,22.0%ofspecializedtechniciansand11.3%agriculturalworkersreportedthat smokingwasprohibitedintheirindoorworkplaces. Analysis indicated that among workplaces without a smoking ban, smoking occurred morefrequently89.2%reportedsmokinghadoccurredattheworkplaceduringthepast 30 days. In places with a complete smoking ban, 25.5% of respondents reported seeing someone smoke. For example, 43.6% of health/medical personnel and 32.4% of teaching staff reported seeing someone smoke in their workplace where smoking was banned. Overall, 63.3% reported that smoking occurred at indoor workplaces. Therefore, the 24
51 proportion of nonsmokers who worked indoors and were protected from secondhand smokewaslow.seedetailsintables6.5,
52 7. Economics KeyFindings: The distribution of cigarette prices in China was skewed. Although some cigarette prices were high, 50% of current smokers spent RMB 5.0 Yuan (~US$0.74)orlesson20manufacturedcigarettes(onepack). Theexpenditureon100packsofmanufacturedcigarettesasapercentageof the2009percapitagrossdomesticproduct(gdp)was2.0% [14]. In the GATS China survey, respondents were asked whether the cigarettes they smokedduringthelast30dayswerepurchasedbythemselvesorcamefromothersources; thosewhopurchasedcigarettesthemselveswereaskedhowmuchtheyspentintheirmost recent purchase and how many cigarettes they bought. Cigarette prices in China varied greatly, ranging from 12 Yuan to hundreds of Yuan. Previous research indicated the distributionofcigarettepricesinchinawasskewed [15].Thereforeinthisreport,themedian amount spent was used to reflect cigarette costs more accurately. GATS China uses the amountspenton100packsofmanufacturedcigarettesasapercentageofgdppercapitato assesswhetherthecostoftobaccoishighenoughtodiscouragetobaccoconsumption. 7.1 Costofpurchasingcigarettes CalculationoftheaveragepriceforChineseindividualsmokertobuyonepackof cigarettesinpast30daysshowsaskeweddistributionofprices,fromalowofrmb 1.00YuanuptoRMB200Yuan,but50%ofcurrentsmokersspentRMB5.0Yuan (~US$0.74)orlesson20manufacturedcigarettes(onepack).(seeTable7.1,Figure 7.1) 26

53 Note:Pointsinfigure7.1showthecumulativepercentofsmokerswhospentdifferent amountofmoneyorlesson20manufacturedcigarettes(onepack). Table 7.2 shows the percentile of amount spent per pack of cigarettes. Only 10.0% spent13.7yuanormoreonapackofcigarettes.thepriceperpackwashigherintheurban areasthaninruralareas.themedianamountwas7.0yuaninurbanareas,and4.9yuanin ruralareas.therewasgreatvariationacrossoccupationgroups.themedianamountspent was 3.9 Yuan for agricultural workers, 5.5 Yuan for machine operators and 9.9 Yuan for leadersoforganizations.seetable7.2fordetails. ChinaNationalTobaccoCompanyclassifiedChinesecigarettesintoclassesonetofive according to the transfer prices (a transfer price refers to the price for cigarette delivery fromcigarettefactoriestothechinanationaltobaccocompanyoritslocalbranches).based onthepricedifferencerateamongtransferprices,wholesaleprices,andretailprices [14],we calculatedtherangesofretailpricesofthefiveclassesofcigarettes,asshownintable7.3. Based on the retail price ranges of different classes of Chinese cigarettes, we calculatedthenumberofchinesesmokerswhoboughtdifferentclassesofcigarettesattheir lastpurchaseandtheresultisshownintable7.4.becausetheretail pricesofclassthree cigarettesrangefrom4.13yuanto10.07yuanandover50%ofsmokersboughtthisclassof cigarettesattheirlastpurchase,classthreecigarettesweredividedintothreesubclasses for analysis. As shown in table 7.4, among Chinese smokers, 51.6% smoke class three cigarettes,22.6%smokeclassfourcigarettes;whileonly7.1%and10.7%smokeclassestwo andonecigarettes,respectively. 27
54 7.2 Expenditureon100packsofmanufacturedcigarettesasapercentageof2009GDPper capita Expenditureon100packsofcigarettesrepresented2.0%of2009GDPpercapita.SeeTable7.5 fordetails. ThisindicatorwaslowerinChinathanseveralotherGATScountries(e.g.,Thailand3.4%,Uruguay 3.0%andBangladesh5.0%),whichindicatedthattherelativecostofcigarettesinChinawasverylow, evencomparedtootherdevelopingcountries. 28
55 8. Warning Labels and Knowledge and Perceptions of Tobacco Harm KeyFindings: Intheprevious30days,over40%ofadultshadnotseenamessageaboutthedangers oftobaccouseorencouragingsmokerstoquit,viathemediaorinpublicplaces. Intheprevious30days,86.7%ofcurrentsmokersreportedhavingseenawarninglabel on a cigarette pack ( Smoking is harmful for your health ) but 63.6% of those did not considerquittingsmokingafterseeingthewarninglabel. Over ¾ ofadultswerenotfullyawareofthehealthhazardscausedbysmokingand exposuretosecondhandsmoke. 35.8%ofrespondentsbelievedthatlowtarcigaretteswerelessharmfultohealththan regular cigarettes and 50.2% did not have an opinion (86.0% in total). Healthcare professionals(54.7%),teachers,andthosewithmoreeducationhadhigherlevelsofthis misconception. 8.1 Morethan40%ofadultsdidnotseeantismokingmessages During the previous 30 days, 59.8% of adults said they had been aware of media or public messages that communicated the hazards of cigarette use or encouraged quitting; 69.0% of urban residentshadseensuchmessages,whichwashigherthaninruralareas,at51.9%. TherewerefivemajorchannelsinChinathroughwhichthepublichadseensmokingandhealth information,includingtelevision(seenby45.4%),newspapersandmagazines(21.8%),billboards(20.5%), public transportation (20.3%), and public walls (18.8%). In addition, 16.5% of people aged 1524 had seensuchinformationontheinternet.seedetailsintable
56 %ofcurrentsmokerswhonoticedthehealthwarningsoncigarettepacksduring thepast30daysdidn tconsiderquitting Warning labels on cigarette packs are one of the most effective ways for the public to receive health messages. They can communicate the hazards of tobacco use and exposure to secondhand smoke, so that people decide to avoid tobacco use and secondhand smoke. A smoker s response to warninglabelsoncigarettepacksindicatestheireffectiveness. Duringtheprevious30days,86.7%ofcurrentsmokershadseenthewarninglabel( Smokingis harmfultoyourhealth )oncigarettepacks,but63.6%ofthosedidnotconsiderquittingsmokingeven afterseeingthewarninglabel. Theeffectofthewarninglabelwasevensmalleramongcurrentsmokerswithprimaryschoolor lesseducation;66.1%ofthosereportedseeingthewarninglabeloncigarettepacksduringthepast30 days,and62.8%saidtheydidnotconsiderquittingsmokingafterseeingthemessage. Althoughmorethan90%ofsmokersamongothereducationgroupsreportedseeingthewarning labels,themajoritydidnotconsidergivingupsmokingasaresultofthemessage;theprevalenceof thosewhodidconsidergivingupsmokingwas41.1%amongthosewithasecondaryschooleducation, 29.0%ofthosewithahighschooleducation,and29.2%ofthosewithacollegeeducationorabove.See detailsintable Morethanthreefourthsofadultsarenotfullyawareofthehealthhazardsofsmoking TheChinesepublichasbecomeveryfamiliarwiththeslogan Smokingisharmfultoyourhealth. However,theiracceptanceofthissloganisnotanappropriatemeasureoftheirpublicknowledgeabout thespecifichealthhazardscausedbytobaccouseorexposuretosecondhandsmoke. GATSresultsrevealedthat81.8%ofadultsknewthatsmokingcausedseverediseases;77.5%were aware that smoking could cause lung cancer, and 27.2% and 38.7% were aware that smoking could cause stroke and heart attack, respectively. The percentage of those who were aware that smoking could cause all three diseases (stroke, heart disease and lung cancer) was only 23.2%. Smokers and nonsmokerswereequallyuninformedaboutthespecificdiseasescausedbysmoking.seetable8.3for details. Rural residents had less awareness of the specific diseases caused by smoking compared with urbanresidents(figure8.1). 30


57 Global Adult Tobacco Survey (GATS) China 2010 Country Report Awareness of the health hazards posed by smoking was also closely correlated with education. The more education respondents had received, the greater their awareness. However, only 41.6% of those with a college and above education, and only 15.7% of those with a primary or less education were aware that smoking could cause all three diseases (Figure 8.2). Medical professionals knew more about the health hazards from smoking than the general public, but only 60.1% of them knew that smoking could cause stroke, 75.9% knew smoking could cause a heart attack, and only 55.8% knew smoking could cause all three diseases (Figure 8.3) 成人烟草调查-中国报告--英文大替换-图形改编号后的 indd :56:54


58 8.4 Adultswereunawareofthehazardsofsecondhandsmoke Thesurveyfoundthat64.3%ofadultsknewthatsecondhandsmokecausedseverediseases.The percentageofadultswhoknewthatsecondhandsmokecouldcauseheartdiseaseamongadultswas 27.5%; 51.0% knew it could cause lung disease among children, and 52.6% knew it could cause lung cancer in adults. Only 24.6% were aware that secondhand smoke could cause all three diseases. See Table8.4fordetails. Rural residents had a lower awareness of the health hazards posed by secondhand smoke comparedwithurbanresidents(figure8.4). 32

. Only 43.")
59 Awarenessofthehealthhazardsposedbysecondhandsmokewascloselyrelatedtoeducation level.only12.5%ofthosewithaprimaryschoolorlesseducationwereawarethatsecondhandsmoke couldcauseallthreediseases(heartdiseaseamongadults,lungdiseaseamongchildrenandlungcancer among adults). Only 43.5% of those with a college or above education were aware that secondhand smokecouldcauseallthreediseases(figure8.5). 33


60 Global Adult Tobacco Survey (GATS) China 2010 Country Report The percentages of teaching staff and medical professionals who were aware that secondhand smoke could cause all three diseases were 46.7% and 62.3%, respectively (Figure 8.6). 34 成人烟草调查-中国报告--英文大替换-图形改编号后的 indd :56:56

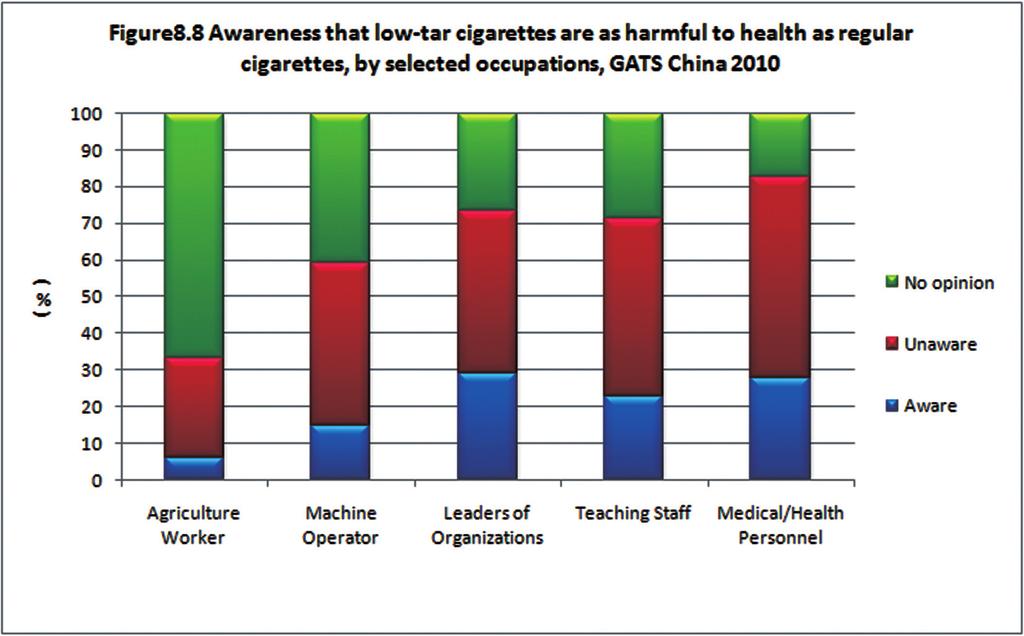
61 8.5 Lackofknowledgeofthehazardsoflowtarcigarettes Researchhasproventhatlowtarcigarettesarenolessharmfulthanregularcigarettes.However, tobaccocompaniesinchinastilluseslogans,suchas, Scientificresearchshowsthatreducedtarmakes cigaretteslessharmful [16]. The results of the GATS survey showed that only 14.0% of adults were aware that lowtar cigaretteswereasharmfultoone shealthasregularcigarettes.35.8%ofadultswereunawareofthe fact,and50.2%hadnoopinion.byoccupation,45.9%ofthosewithacollegeoraboveeducationwere unaware that lowtar cigarettes were as harmful to one s health as regular cigarettes, compared to 21.3%amongthosewithprimaryschoolorlesseducation;whilethepercentagesof noopinion among these two educational groups were 23.8% and 73.1%, respectively (Figure 8.7). Similar results were foundbyoccupation.57.4%ofmedicalprofessionalsand27.1%ofthefarmerswereunawarethatlow tar cigarettes are as harmful to health as regular cigarettes, while the percentages of no opinion among these two occupational groups were 17.4% and 66.9%, respectively. (Figure 8.8). The proportionofthosewithmisconceptionswashigheramongcurrentsmokersthanamongnonsmokers. SeeTable8.5fordetails. 35
62 36
63 9. Tobacco Advertising, Sponsorship, and Promotion KeyFindings: Duringtheprevious30days,19.6%ofadultssurveyedhadnoticedtobacco advertisementsandpromotionsinthemediaorinpublicplaces. Duringtheprevious30days,49.8%ofadultswhohadnoticedtobacco advertisementsreportedseeingtobaccoadvertisingontelevisions. Tobacco companies use advertising and promotions to attract new smokers, increase cigarette consumption,reducesmokers desiretoquitsmoking,andencourageformersmokerstostartsmoking again.thiscansignificantlyincreasethesaleandconsumptionoftobacco.therefore,article13ofthe WHO FCTC and its implementation rules specify that there should be a universal ban on all tobacco advertising,promotionsandsponsorships.itisthusessentialtounderstandtowhatextentthepublicis exposedtotobaccoadvertising,promotionsandsponsorshipthroughthemediaandinpublicplaces.it is particularly important to measure tobacco advertising in the media, which has been completely bannedbychineselawsince About20%ofpeoplenoticedadvertisements,promotionsorsponsorships Duringtheprevious30days,19.6%ofadultsreportedthattheyhadnoticedtobaccoadvertising, promotionsorsponsorshipsthroughthemediaorinpublicplaces.amongthosewhonoticedthese,the proportionofthosenoticingtobaccoadvertisementswas76.3%,muchhigherthanforpromotionsand sponsorships,whichwere20.2%and25.5%respectively.more urbanresidents(24.2%)reportedthat theyhadseentobaccoadvertisementsorpromotions,comparedtotheruralresidents(15.7%).amuch higher proportion of young people especially males aged 1524 years old had noticed tobacco advertisements, promotions or sponsorships. The proportion among young urban men was 39.1%. (Figure9.1). 37
64 9.2Diversifiedwaysfortobaccoadvertisement,promotionandsponsorship Abouthalfor49.8%ofrespondentswhohadnoticedtobaccoadvertisementreportedseeingiton television,followedbybillboardsandstoreswherecigarettesaresold(seefigure9.2),while16.5%of youngmen(1524yearsold)hadnoticedtobaccoadvertisingontheinternet.thislatterproportionwas muchhigheramongyoungmenlivinginurbanthanthoseinruralareas. Amongpeoplewhonoticedtobaccopromotions,46.5%noticedsinglesales,followedbyclothingor otheritemswithacigarettebrandnameorlogo,andfreegiftsorspecialdiscountoffersonother productswhenbuyingcigarettes.singlesalepromotionswerethemostcommonformreported, especiallyinruralareasandamongyoungpeopleaged1524(51.0%and64.6%,respectively).inthe EastandCentralregionsofChina,morepeoplenoticedfreegiftswithpurchases. About89%ofrespondentswhonoticedtobaccosponsorshipssawtheminsportsoratsporting events,followedbymusic,theatre,art,orfashionevents.therewasnodifferencebetweenregions. 38
65 39
66 Chapter10.Conclusions,discussionsandsuggestions 10.1Majorconclusions AseriesofinterestingfindingswasobtainedfromtheChinaGlobalAdultTobaccoSurvey(GATS). Thesurveyresults,incombinationwithpreviousthreelargescaleepidemiologicalsurveysconductedin China since 1984, revealed changes in smoking and cessation among the Chinese population. At the same time, the survey also served as an assessment of the implementation of key tobacco control strategies (MPOWER) in China, namely, protecting people from tobacco smoke, offering help to quit tobaccouse,warningaboutthedangersoftobacco,enforcingbansontobaccoadvertising,promotion andsponsorship,andraisingtaxesontobacco. Bydoingso,GATSChinahasprovidedthegovernment ofchinawithrobustevidencefordevelopingmoreeffectivetobaccocontrolstrategies. Thefollowingarethefivemostimportantconclusionsdrawnfromthissurvey: MalecurrentsmokingprevalenceinChinaremainsatahighlevel. TheresultsoftheGATSChinasurveydocumentsthatthecurrentsmokingprevalenceamongmales isveryhigh.amongmalesaged15andabove,thecurrentsmokingprevalencewas52.9%,andcurrent smokingprevalenceamongmiddleagedmales(4059yearsold)increased.theoverallfemalesmoking prevalenceisrelativelylow.amongeverdailysmokers2034yearsold,52.7%starteddailysmoking beforetheageof Only16.9%ofeversmokershadquitsmoking,andamongthosewhohavetried,the relapseproportionishigh. Amongeversmokers,16.9%hadquitsmoking.Halfofcurrentdailysmokerssmokedwithin30minutes afterwaking,andmostsmokers(91.8%)whoattemptedtoquitsmokinghadnotreceivedanycessation aids SHSexposureremainsaveryseriousissue SHSexposureremainsaveryseriousissue,with72.4%ofnonsmokersexposedtoSHS.Noticing smokinginpublicplacesandatworkplaceswasverycommon:88.5%ofrespondentswereexposedto 40
67 SHSinrestaurants,58.4%ingovernmentbuildings,andapproximately35.0%inhealthcarefacilities, schoolsandpublictransport,while67.3%adultsreportedthatsmokingoccurredathome LowawarenessoftheharmsofsmokingandSHS Althoughmostpeopleagreedthatsmokingwasharmfultoone shealth,lessthan25.0%possesseda comprehensiveunderstandingofthespecifichealthhazardsofsmokingandshs.only23.2%ofpeople wereawarethatsmokingcouldcausestroke,heartattackandlungcancer;only24.6%wereawarethat SHScouldcauseheartdiseaseandlungcancerinadults,aswellaslungillnessesinchildren. 35.8%mistakenlybelievedand50.2%hadnoopinion(86.0%intotal)thatlowtarcigaretteswere less harmful to one s health [17].Among medical professionals, teachers, and people with higher education,theproportionofpeopleholdingmisconceptionsaboutlowtarcigaretteswasevenhigher. For example, 54.7% of medical professionals believed that lowtar cigarettes were less harmful than regularcigarettes.accordingtocommunicationtheory,usuallyhighlyeducatedpopulationshouldhave higher knowledge level. The reasons for this phenomenon found in GATS China need to be further studied Theimplementationofstrategiesandmeasuresontobaccocontrolneedstobe strengthened BasedontheWHOFCTC,WHOhasintroducedapackageofselecteddemandreductionmeasures aimedatreversingthetobaccoepidemicthempowerpackage.gatsevaluatedchina scurrent statuswithrespecttothesestrategies,shownintable10.1.theresultsshowroomforimprovement. Forexample,72.7%ofpeoplehadnoticedsmokingoccurredinpublicplacesand63.3%hadnoticed smokingattheirindoorworkplaces,indicatingthattheshsexposureprevalenceremainedatahigh level. Thecombinedeffectsoftheabovefactorsresultinthehighcurrentsmokingprevalenceamong adultmales,nosignificantimprovementinquitproportionforsmoking,andtherelativelyhighexposure prevalencetoshs. 10.2ThestrengthsandlimitationsofGATSChina Strengths 41
68 GATSChinahasseveralstrengths.First,GATSChinautilizedstratifiedmultistagerandomsampling technique.mappingandlistingwereusedtoimprovetheaccuracyofthesamplingframe.no replacementwasallowedduringthewholesamplingprocedure.therefore,thestudysampleis representativetothenoninstitutionalizedadultresidentsaged15yearsandabove.second,thecore questionsofgatschinaareconsistentwiththoseusedinothergatscountries,whichallowsfor comparisonsamonggatscountries;meanwhile,weusedafewkeyquestionsthatwereusedin previoustobaccousesurveysconductedinthe1996and2002surveys,whichallowsforlongitudinal comparisonswithprevioussurveysinchina.third,ipaqhandheldswereusedinthefieldworktocollect dataandelectronicdatawereuploadedtochinacdceveryweek.thisisthefirsttimethatchinaused electronicdatacollectiontechniqueinpublichealthsurveys,whichprovedtobetimeefficientand improvedthequalityofthecollecteddata.strictqualitycontrolmeasureswereusedduringthewhole processofthesurvey,whichguaranteedthedataquality Limitations ThemajorlimitationsofGATSChinainclude: First,GATSChinaisahouseholdsurvey.ThetargetpopulationwasdefinedasallChineseresidents, aged15andabove,livingintheirprimaryresidencepriortothesurveydate,excludinginstitutionalized residentsandfloatingpopulation.inchina,theterm floatingpopulation referstopeoplewhousually donotworkandresideatthesiteoftheirhouseholdregistration.floatingpopulationsaretheresultof thehouseholdregistrationsystemandtherapidurbanizationinchina.mostfloatingpopulationare laborswhomovefromruralareastourbanareas.usuallythesepeopleliveindormsortemporary quartersbutnorintheirregularhouseholds.sincethe1980 s,withtherapiddevelopmentofthe economyandsocietyinchina,thefloatingpopulationhasincreaseddramatically,estimatedatmore than200million.becausecurrentsmokingprevalenceinthefloatingpopulationisusuallyhigherthanin generalpopulation [18],thesamplingandsurveymethodsmayhaveresultedinunderestimating smoking prevalence. Second,inthe1996and2002surveys,SHSexposurewasdefinedasexposurebynonsmokersto SHSatleast15minutesperdayandonedayperweek.SincethereisnosafelevelforSHSexposure [1],in GATSChina,SHSexposurewasdefinedasexposuretoSHSbynonsmokersatleastonedayperweek. Becausethecurrentdefinitionismoreaccurateandstringent,itwasnotsurprisingthattheSHS 42
69 exposureprevalencefoundusingthisdefinitionwashigherthanpreviousfindings.additionally, increasedawarenessofthepublictoshsmayalsoresultingreaterreportingofexposure.becauseof thedifferentdefinitions,theshsexposureprevalencecouldnotbedirectlycomparedwiththeprevious data.however,gatschinausedmorereliableindicators,i.e.,whetherpeoplehadnoticedsmokingin differentvenues,tomeasureshsexposureintheseplaces.throughtheanalysesofshsexposurein differentpopulationsandvenues,itwasconcludedthatshsexposureisstillaseriousprobleminchina. 10.3Suggestions ThisreportprovidessolidevidencethatthecurrentsmokingprevalenceamongChineseadult malesremainedhigh.thepublichaslowawarenessoftheharmsofsmokingandshs,andthe implementationoftobaccocontrolstrategieswasweak.ifthecurrentpatternpersists,tobaccowill causeseriouslosstothechinesepublichealth,economy,andsociety.therefore,urgentmeasuresare neededtoeffectivelyimplementwhofctcprovisionsandhaltthetobaccoepidemicinchina.itisvital tointroducemidandlongtermplansfornationaltobaccocontrolforthwith,whichincludethe implementationofwhofctcatthenational,regionalandlocallevel.introducinglawsaddressingthe preventionandcontroloftobaccoharmsatthenationallevelwouldprovidethelegalbasisfortobacco controlandimplementationofwhofctc.basedonthefindingsfromgatschina,weproposedthe followingspecificsuggestions: 1.GATSChinafoundhighSHSexposureprevalenceamongnonsmokers,lackofcomprehensive smokefreepolicies,andrelativelyweakimplementationofexistingsmokefreepolicies.currently,china doesn thaveacomprehensivesmokefreelawatthenationallevel.however,severalnationallawsand policiesregulatesmokinginpublicplaces.forexample,lawofthepeople srepublicofchinaonthe ProtectionofMinorsbanssmokingintheclassrooms,dorms,andactivityroomsofmiddleorprimary schools,kindergartensandnurseries.lawofthepeople srepublicofchinaontobaccomonopolybans orrestrictssmokinginpublictransportationvehiclesorpublicvenues.regulationsonthesanitary AdministrationofPublicPlacesbanssmokingingymnasiums,libraries,museums,artgalleries, marketplaces,bookstores,publictransportwaitingrooms,trains,passengerliners,andaeroplanes.on March22,2011,theMinistryofHealthreleasedthe DetailedImplementationRulesforRegulationson 43
70 thesanitaryadministrationofpublicplaces,whichtookeffectonmay1,2011.article18banssmoking inindoorpublicplaces.however,thereisnoinformationaboutenforcementorfinesandother penaltiesforviolationofthesmokefreeregulations,andworkplaceswerenotcovered.tolowershs exposureinchina,smokefreelegislationinchinamustbestrengthenedtoprotectpeoplefromtobacco smoke. 2.Currently,mostsmokersdonotobtainprofessionalhelpforcessation.Relativelyfewhealthcare professionalsaskpatientsabouttheirsmokinghistoryandadvisesmokerstoquitsmoking.professional normsshouldbeestablishedtoencouragehealthcarepersonneltoincorporatebriefcessationadvice intoroutinehealthcareprocess.servicestohelpsmokersquitshouldbeincludedintothepublichealth servicepackage.includingcessationmedicationsinthebasichealthinsurancereimbursementlistmay helpboosttheuseprevalenceofthesemedications. 3.ThecurrentcigarettepackagehealthwarningsinChinafallshortoftherequirementsofthe WHOFCTCanditsimplementationguidelines [19],andlevelsofknowledgeabouttheharmsoftobacco arelow.revisingthepackagehealthwarningsbasedontherequirementsofthewhofctcwillhelp increasetheknowledgelevelofthechinesepeopleabouttheharmsofsmoking. 4.Chinahasnotyetcomprehensivelybannedtobaccoadvertising,promotionandsponsorship.The 1994AdvertisementLawonlybanstobaccoadvertisementinfourkindsofplaces(allkindsofwaiting rooms,cinemas,meetingrooms,andstadiums)andfivekindsofmedia(radios,movies,tv,newspapers, andmagazines).thegatschinafoundthat19.5%oftheadultswereexposedtotobaccoadvertisement duringthepast30days.evenintvwheretobaccoadvertisementwasbannedbytheadvertisementlaw, tobaccoadsstillexist.in2011,thestateadministrationofradio,filmandtelevisionreleasednotice fromthestateadministrationofradio,filmandtelevisiontocontrolsmokingscenesinfilmsand Teleplays.Thisisabigsteptowardsbanningtobaccoadvertising,promotionandsponsorship.China shouldtakefurtherstepstorevisetheadvertisementlawtocomprehensivelybantobaccoadvertising, promotion,andsponsorship. 5.SinceChinaratifiedWHOFCTCin2006,thepricesoftobaccoproductshasnotchanged, especiallyforlowpricedcigarettes.althoughchinaraisedcigaretteexcisetaxesin2009,theretailprices 44
71 ofchinesecigaretteswerenotaffected,thusthechangeincigarettetaxeshadnoeffectsoncigarette consumption.ingatschina,wefoundthatcigarettepricesinchinawererelativelylow,the expenditureon100packsofmanufacturedcigarettesasthepercentof2009percapitagrossdomestic Product(GDP)wasonly2.0%.MeasuresshouldbetakentoencouragetheMinistryofFinanceandState AdministrationofTaxtoraisecigaretteexcisetaxessoastoraisetheretailprices,whichwillinturn reducecigaretteconsumptionandpreventmanyyouthfromstartingsmoking. 6.TounderstandthetrendsintobaccouseinChinaandtoevaluatetheeffectsoftobaccocontrol measuresovertime,routinemonitoringandevaluationatthenationallevelshouldbeconductedto provideevidenceformakingeffectivetobaccocontrolpoliciesandmeasures. 45
72 References [1] WorldHealthOrganization.WHOreportontheglobaltobaccoepidemic,2008:theMPOWERpackage. Geneva,2008. [2] MathersCD,LoncarD.Projectionsofglobalmortalityandburdenofdiseasefrom2002to2030.PloS Medicine,2006,3(11):442. [3] LiuBQ,PetoR,ChenZM,etal.EmergingtobaccohazardsinChina:1.Retrospectiveproportional mortalitystudyofonemilliondeaths.bmj,1998,317(7170): [4] WorldHealthOrganization.WHOFrameworkConventiononTobaccoControl.Geneva,2004. [5] WengX,HongZ,ChenD.SmokingprevalenceinChineseaged15andabove.ChinMedJ(Engl),1987, 100(11): [6] YangG,FanL,TanJ,etal.SmokinginChina:findingsofthe1996NationalPrevalenceSurvey.JAMA, 1999,282(13): [7] YangG.DeathandtheirriskfactorsamongChinesepopulation.Beijing:PekingUnionMedicalCollege Press,2005. [8] YangG,MaJ,LiuN,etal.SmokingandpassivesmokinginChinese,2002.ZhonghuaLiuXingBingXueZa Zhi,2005,26(2):7783. [9] XiaoL,YangJ,YangG.WhatistheprevalenceofsmokinginChinacomparisonofthreenational tobaccosurveys.zhonghualiuxingbingxuezazhi,2009,30(1):3033. [10] CenterforHealthStatisticsandInformation,ChinaMinistryofHealth.AnanalysisreportofNational HealthServicesSurveyinChina,2004.Beijing:PekingUnionMedicalCollegePress,2004. [11] CenterforHealthStatisticsandInformation,ChinaMinistryofHealth.AnanalysisreportofNational HealthServicesSurveyinChina,2008.Beijing:PekingUnionMedicalCollegePress,2008. [12] ChineseCenterforDiseaseControlandPrevention.Reportonchronicdiseaseriskfactorsurveillancein China,2004.Beijing:PekingUnionMedicalCollegePress,2009. [13] ChineseCenterforDiseaseControlandPrevention.Reportonchronicdiseaseriskfactorsurveillancein China,2007.Beijing:People smedicalpublishinghouse,2010. [14] MaoZ,HuD,YangG.NewevaluatingofthedemandforcigarettesfromChineseresidents.Chinese JournalofHealthEconomics,2005,24(5):4547. [15] LiQ,HylandA,FongG,etal.UseoflessexpensivecigarettesinsixcitiesinChinafindingfromthe InternationalTobaccoControl(ITC)ChinaSurvey.TobControl,2010,19(suppl2):i6368. [16] EltonMarshallT,FongG,ZannaM,etal.Beliefsabouttherelativeharmof light and lowtar cigarettes:findingsfromtheinternationaltobaccocontrol(itc)chinasurvey.tobcontrol,2010,19(suppl 2):i
73 [17] NationalCancerInstitute.Risksassociatedwithsmokingcigaretteswithlowmachinemeasuredyields oftarandnicotine.smokingandtobaccocontrolmonographno.13.bethesda,md:usdepartmentofhealth andhumanservices,nationalinstitutesofhealth,nationalcancerinstitute;2001.availablefrom: [18] StateTobaccoMonopolyBureau.Cigarettesconsumptioninrecurrentpopulation.Availablefrom: [19] FongF,HammondD,JiangY,etal.PerceptionsoftobaccohealthwarningsinChinacomparedwith pictureandtextonlyhealthwarningsfromothercountries:anexperimentalstudy.tobcontrol,2010, 19(suppl2):i
74 AppendixA:ChinaGATSQuestionnaire Household Questionnaire INTERVIEWER: THE HOUSEHOLD SCREENING RESPONDENT MUST BE 18 YEARS OF AGE OR OLDER AND YOU MUST BE CONFIDENT THAT THIS PERSON CAN PROVIDE ACCURATE INFORMATION ABOUT ALL MEMBERS OF THE HOUSEHOLD. IF NEEDED, VERIFY THE AGE OF THE HOUSEHOLD SCREENING RESPONDENT TO MAKE SURE HE/SHE IS 18 YEARS OF AGE OR OLDER. INTRO: An important survey of adult tobacco use behavior is being conducted by the [FILL COUNTRY SPONSORING AGENCY] throughout China and your household has been selected to participate. All houses selected were chosen from a scientific sample and it is very important to the success of this project that each participates in the survey. All information gathered will be kept strictly confidential. I have a few questions to find out who in your household is eligible to participate. HH1. First, I d like to ask you a few questions about your household. In total, how many persons live in this household? INTERVIEWER: INCLUDE ANYONE WHO CONSIDERS THIS HOUSEHOLD THEIR PRIMARY PLACE OF RESIDENCE PERSONS HH2. How many of these household members are 15 years of age or older? PERSONS IF HH2 = 00 (NO ELIGIBLE PERSONS IN HOUSEHOLD), END INTERVIEW AND RECORD THE TIME THE INTERVIEW ENDED. ENTER RESULT CODE
75 HH4. I now would like to collect information about only these persons that live in this household who are 15 years of age or older. Let s start listing them from oldest to youngest. ASK THE FOLLOWING QUESTIONS AND RECORD ANSWERS IN TABLE BELOW a. What is this person s first name? b. What is this person s age? IF RESPONDENT DOESN T KNOW, PROBE FOR AN ESTIMATE c. IF REPORTED AGE IS 15 THROUGH 17, ASK FOR BIRTH DATE: What is the month and year of this person s date of birth? CHECK TO VERIFY IF DATE OF BIRTH FALLS BEFORE THE DATE OF [FILL MONTH/YEAR] TO MAKE SURE PERSON IS 15 OR OLDER. IF NOT 15 OR OLDER, DELETE LINE. IF RESPONDENT DOESN T KNOW DATE OF BIRTH, CONTINUE TO d d. Is this person male or female? e. Does this person currently smoke tobacco, including cigarettes, cigars, pipes, hand-rolled cigarettes? ONLY IF AGE = a. First Name b. Age c. Date of Birth d. Gender e. Current Smoker? Month: Year: Month: Year: Month: Year: Month: Year: Month: Year: Month: Year: Month: Year: Month: Year: M F YES NO DK Month: Year: Month: Year:
76 SELECTION OF INDIVIDUAL RESPONDENT USING RANDOMIZATION TABLE: NUMBER OF ELIGIBLE PERSONS IN HOUSEHOLD LAST DIGIT OF QUESTIONNAIRE ID NUMBER END INTERVIEW USE RANDOMIZATION TABLE ABOVE TO SELECT INDIVIDUAL RESPONDENT AND WRITE THE SELECTED NUMBER IN HH5 BELOW -IF ONLY ONE ELIGIBLE person LIVES IN THE HOUSEHOLD, WRITE 1 IN HH5 -IF NO ELIGIBLE person LIVE IN THE HOUSEHOLD, WRITE 0 IN HH5 AND END INTERVIEW -IF MORE THAN 10 person LIVE IN THE HOUSEHOLD, END THE INTERVIEW AND CONSULT WITH YOUR SUPERVISOR BEFORE SELECTING ANYONE FOR THE INDIVIDUAL INTERVIEW HH5. HOUSEHOLD ROSTER NUMBER OF THE SELECTED ELIGIBLE PERSON 50
77 HH6. FILL IN QUESTIONNAIRE ID NUMBER QUESTIONNAIRE ID NUMBER: - 51
78 INT: IF YOU DO NOT SPEAK WITH THE SELECTED RESPONDENT OR IF HE/SHE IS NOT AVAILABLE FOR AN INTERVIEW AT THAT TIME, WRITE DOWN HIS/HER NAME AND SCHEDULE ANOTHER VISIT (DATE AND TIME) NAME DATE OF THE NEXT VISIT: DATE OF THE NEXT VISIT: DATE OF THE NEXT VISIT: DATE OF THE NEXT VISIT: TIME: TIME: TIME: TIME: TIME HH INTERVIEW ENDED [24 HOUR CLOCK] : HRS MINS 52
79 Individual Questionnaire QUESTIONNAIRE ID NUMBER - CONSENT1. CHECK AGE OF SELECTED RESPONDENT FROM THE HOUSEHOLD QUESTIONNAIRE CASE DETAILS, AND SELECT THE APPROPRIATE CATEGORY BELOW: [GO TO CONSENT2] 18 OR OLDER... 2 [GO TO CONSENT5] EMANCIPATED MINOR (15-17)... 3 [GO TO CONSENT5] CONSENT2. Before starting the interview, I need to obtain consent from a parent or guardian of [NAME OF RESPONDENT] and from [NAME OF RESPONDENT]. IF BOTH SELECTED RESPONDENT AND PARENT/GUARDIAN ARE AVAILABLE, CONTINUE WITH INTERVIEW. IF PARENT/GUARDIAN IS NOT AVAILABLE, BREAK-OFF INTERVIEW AND SCHEDULE AN APPOINTMENT TO RETURN. IF MINOR RESPONDENT IS NOT AVAILABLE, CONTINUE WITH OBTAINING PARENTAL CONSENT. 53
80 CONSENT3. READ THE FOLLOWING TO THE PARENT/GUARDIAN AND SELECTED RESPONDENT (IF AVAILABLE): I am working with [Name of Organization]. This institution is collecting information about tobacco use in [Country]. This information will be used for public health purposes by the Ministry of Health. Your household and [NAME OF RESPONDENT] have been selected at random. [NAME OF RESPONDENT] responses are very important to us and the community, as these answers will represent many other persons. The interview will last around 30 minutes. [NAME OF RESPONDENT] participation in this survey is entirely voluntary. The information that [NAME OF RESPONDENT] will provide will be kept strictly confidential and [NAME OF RESPONDENT] will not be identified by his/her responses. Personal information will not be shared with anyone else, not even other family members including you. [NAME OF RESPONDENT] can withdraw from the study at any time, and may refuse to answer any question. We will leave the necessary contact information with you. If you have any questions about this survey, you can contact the telephone numbers listed. If you agree with [NAME OF RESPONDENT] s participation in this survey, we will conduct a private interview with him/her. ASK PARENT/GUARDIAN: Do you agree with [NAME OF RESPONDENT] s participation? YES... NO... 1 [GO TO CONSENT4] 2 [END INTERVIEW] CONSENT4. WAS THE SELECTED MINOR RESPONDENT PRESENT? PRESENT... NOT PRESENT... 1 [GO TO CONSENT6] 2 [GO TO CONSENT5] 54
81 CONSENT5. READ TO THE SELECTED RESPONDENT: I am working with [Name of Organization]. This institution is collecting information about tobacco use in [Country]. This information will be used for public health purposes by the Ministry of Health. Your household and you have been selected at random. Your responses are very important to us and the community, as these answers will represent many other persons. The interview will last around 30 minutes. Your participation in this survey is entirely voluntary. The information that you will provide us will be kept strictly confidential, and you will not be identified by your responses. Personal information will not be shared with anyone else, not even other family members. You can withdraw from the study at any time, and may refuse to answer any question. We will leave the necessary contact information with you. If you have any questions about this survey, you can contact the telephone numbers listed. {FILL IF CONSENT4=2: Your parent/guardian has given his/her permission for you to participate in this study} If you agree to participate, we will conduct a private interview with you. CONSENT6. ASK SELECTED RESPONDENT: Do you agree to participate? YES... NO... 1 [PROCEED WITH INTERVIEW] 2 [END INTERVIEW] FILL IN THE FOLLOWING INFORMATION: INTERVIEW LANGUAGE 1 [MANDARIN] TIME INTERVIEW BEGAN [24 HOUR CLOCK] : HRS MINS 55
82 SECTION A. BACKGROUND CHARACTERISTICS INTRO: I am going to first ask you a few questions about your background. A1. INTERVIEWER: RECORD GENDER FROM OBSERVATION. ASK IF NECESSARY. MALE... 1 FEMALE... 2 A2. What is the month and year of your date of birth? MONTH: IF DON T KNOW, ENTER 77 YEAR: IF DON T KNOW, ENTER 7777 INT: IF MONTH=77 OR YEAR=7777 IN A2, ASK A3. OTHERWISE SKIP TO A4. A3. How old are you? INTERVIEWER: IF RESPONDENT IS UNSURE, PROBE FOR AN ESTIMATE AND RECORD AN ANSWER YEARS OLD A3a. INTERVIEWER: WAS RESPONSE ESTIMATED? YES... 1 NO... 2 DON T KNOW
83 A4. What is the highest level of education you have completed? INTERVIEWER: SELECT ONLY ONE CATEGORY NO FORMAL SCHOOLING... 1 LESS THAN PRIMARY SCHOOL COMPLETED... 2 PRIMARY SCHOOL COMPLETED... 3 LESS THAN SECONDARY SCHOOL COMPLETED... 4 SECONDARY SCHOOL COMPLETED... 5 HIGH SCHOOL COMPLETED/ TECHNICAL SECONDARY SCHOOL... 6 COLLEGE/UNIVERSITY COMPLETED... 7 POST GRADUATE DEGREE COMPLETED... 8 DON T KNOW A5. Which of the following best describes your main work status over the past 12 months? Agriculture, forestry, animal husbandry, fishery and water conservation employees... 1 Operators of production or transportation equipment and related personnel... 2 Businessmen or service industry employees... 3 Leaders of governments, Chinese Communist party organizations, companies or institutions 4 Clerks... 5 Specialized technicians... 6 Medical and health personnel... 7 Teaching staff... 8 Soldiers... 9 Students No job Retired Other occupations specify: Don t know
84 A6. Please tell me whether this household or any person who lives in the household has the following items: READ EACH ITEM: YES NO DON T KNOW a. Electricity? b. Flush toilet? c. Fixed telephone? d. Cell telephone? e. Television? f. Radio? g. Refrigerator? h. Car? i. Moped/scooter/motorcycle? j. Washing machine? k. air-conditioner/heater?
85 SECTION B. TOBACCO SMOKING INTRO: I would now like to ask you some questions about smoking tobacco, including cigarettes, cigars, pipes, hand-rolled cigarettes. B1. Do you currently smoke tobacco on a daily basis, less than daily, or not at all? DAILY... 1 SKIP TO B4 LESS THAN DAILY... 2 NOT AT ALL... 3 SKIP TO B3 DON T KNOW... 7 SKIP TO NEXT SECTION B2. Have you smoked tobacco daily in the past? YES... NO... DON T KNOW... 1 SKIP TO B8 2 SKIP TO B10 7 SKIP TO B10 B3. In the past, have you smoked tobacco on a daily basis, less than daily, or not at all? INTERVIEWER: IF RESPONDENT HAS DONE BOTH DAILY AND LESS THAN DAILY IN THE PAST, CHECK DAILY DAILY... LESS THAN DAILY... NOT AT ALL... DON T KNOW... 1 SKIP TO B11 2 SKIP TO B13 3 SKIP TO NEXT SECTION 7 SKIP TO NEXT SECTION 59
86 [CURRENT DAILY SMOKERS] B4. How old were you when you first started smoking tobacco daily? YEARS OLD IF DON T KNOW, ENTER 99 INT: IF B4 = 99, ASK B5. OTHERWISE SKIP TO B6. B5. How many years ago did you first start smoking tobacco daily? YEARS B6. On average, how many of the following products do you currently smoke each day? Also, let me know if you smoke the product, but not every day. INTERVIEWER: IF RESPONDENT REPORTS SMOKING THE PRODUCT BUT NOT EVERY DAY, ENTER 888 IF RESPONDENT REPORTS IN PACKS OR CARTONS, PROBE TO FIND OUT HOW MANY ARE IN EACH AND CALCULATE TOTAL NUMBER READ EACH ITEM: a. Manufactured cigarettes? PER DAY a1. [IF B6a=888] On average, how many manufactured cigarettes do you currently smoke each week? PER WEEK b. Hand-rolled cigarettes? PER DAY b1. [IF B6b=888] On average, how many hand-rolled cigarettes do you currently smoke each week? PER WEEK d. Pipes full of tobacco? PER DAY d1. [IF B6d=888] On average, how many pipes full of tobacco do you currently smoke each week? PER WEEK e. Cigars, cheroots, or cigarillos? PER DAY e1. [IF B6e=888] On average, how many cigars, cheroots, or cigarillos do you currently smoke each week? PER WEEK f. Number of water pipe sessions per day? PER DAY f1. [IF B6f=888] On average, how many water pipe sessions do you currently participate in each week? PER WEEK 60
87 g. Any others? (Specify type: ) PER DAY g1. [IF B6g=888] On average, how many [FILL PRODUCT] do you currently smoke each week? PER WEEK 61
88 B7. How soon after you wake up do you usually have your first smoke? Would you say within 5 minutes, 6 to 30 minutes, 31 to 60 minutes, or more than 60 minutes? WITHIN 5 MINUTES TO 30 MINUTES TO 60 MINUTES... 3 MORE THAN 60 MINUTES... 4 INT: SKIP TO NEXT SECTION 62
89 [CURRENT LESS THAN DAILY SMOKERS] B8. How old were you when you first started smoking tobacco daily? YEARS OLD IF DON T KNOW, ENTER 99 INT: IF B8 = 99, ASK B9. OTHERWISE SKIP TO B10. B9. How many years ago did you first start smoking tobacco daily? YEARS B10. How many of the following do you currently smoke during a usual week? INTERVIEWER: IF RESPONDENT REPORTS DOING THE ACTIVITY WITHIN THE PAST 30 DAYS, BUT LESS THAN ONCE PER WEEK, ENTER 888 IF RESPONDENT REPORTS IN PACKS OR CARTONS, PROBE TO FIND OUT HOW MANY ARE IN EACH AND CALCULATE TOTAL NUMBER READ EACH ITEM: a. Manufactured cigarettes?... PER WEEK b. Hand-rolled cigarettes?... PER WEEK d. Pipes full of tobacco?... PER WEEK e. Cigars, cheroots, or cigarillos?... PER WEEK f. Number of water pipe sessions per week?... PER WEEK g. Any others?... PER WEEK Specify type: INT: SKIP TO NEXT SECTION 63
90 [FORMER SMOKERS] B11. How old were you when you first started smoking tobacco daily? YEARS OLD IF DON T KNOW, ENTER 99 INT: IF B11 = 99, ASK B12. OTHERWISE SKIP TO B13. B12. How many years ago did you first start smoking tobacco daily? YEARS B13. How long has it been since you stopped smoking? INTERVIEWER: ONLY INTERESTED IN WHEN RESPONDENT STOPPED SMOKING REGULARLY -- DO NOT INCLUDE RARE INSTANCES OF SMOKING ENTER UNIT AND NUMBER YEARS... 1 MONTHS... 2 WEEKS... 3 DAYS... 4 LESS THAN ONE DAY (24 HOURS)... 5 DON T KNOW... 7 INT: IF B13 < 1 YEAR (< 12 MONTHS), THEN CONTINUE WITH B14. OTHERWISE SKIP TO NEXT SECTION. 64
91 B14. Have you visited a doctor or other health care provider in the past 12 months? YES... 1 NO... 2 SKIP TO B18 B15. How many times did you visit a doctor or health care provider in the past 12 months? Would you say 1 or 2 times, 3 to 5 times, or 6 or more times? 1 OR TO OR MORE... 3 B16. During any visit to a doctor or health care provider in the past 12 months, were you asked if you smoke tobacco? YES... 1 NO... 2 SKIP TO B18 B17. During any visit to a doctor or health care provider in the past 12 months, were you advised to quit smoking tobacco? YES... 1 NO... 2 B18. During the past 12 months, did you use any of the following to try to stop smoking tobacco? READ EACH ITEM: YES NO a. Counseling, including at a smoking cessation clinic? b. Nicotine replacement therapy, such as the patch or gum? c. Other prescription medications, that are non-traditional medicines? d. Traditional herb medicines/acupuncture? e. A quit line or a smoking telephone support line? f. Switching to smokeless tobacco? ff. Electro smoke g. Anything else? Specify:
92 SECTION C. SMOKELESS TOBACCO INTRO: The next questions are about using smokeless tobacco, such as snuff, chewing tobacco, and dip. C1. Do you currently use smokeless tobacco on a daily basis, less than daily, or not at all? DAILY... 1 SKIP TO NEXT SECTION LESS THAN DAILY... 2 NOT AT ALL... 3 SKIP TO C3 DON T KNOW... 7 SKIP TO NEXT SECTION C2. Have you used smokeless tobacco daily in the past? YES... NO... DON T KNOW... 1 SKIP TO NEXT SECTION 2 SKIP TO NEXT SECTION 7 SKIP TO NEXT SECTION C3. In the past, have you used smokeless tobacco on a daily basis, less than daily, or not at all? INTERVIEWER: IF RESPONDENT HAS DONE BOTH DAILY AND LESS THAN DAILY IN THE PAST, CHECK DAILY DAILY... LESS THAN DAILY... NOT AT ALL... DON T KNOW... 1 SKIP TO NEXT SECTION 2 SKIP TO NEXT SECTION 3 SKIP TO NEXT SECTION 7 SKIP TO NEXT SECTION 66
93 SECTION D1. CESSATION TOBACCO SMOKING INT: CHECK THE ANSWER TO B1 AND RECORD BELOW: B1 = IF B1 = 1 or 2 (RESPONDENT CURRENTLY SMOKES TOBACCO), THEN CONTINUE WITH THIS SECTION... 1 IF B1 = 3 or 7 (RESPONDENT DOES NOT CURRENTLY SMOKE TOBACCO), THEN SKIP TO NEXT SECTION... 2 INTRO: The next questions ask about any attempts to stop smoking that you might have made. Please think about tobacco smoking. DD1. Have you ever tried to stop smoking? YES... 1 NO... 2 SKIP TO D4 D1. During the past 12 months, have you tried to stop smoking? YES... 1 NO... 2 SKIP TO D4 D2. Thinking about the last time you tried to quit, how long did you stop smoking? INTERVIEWER: ENTER UNIT AND NUMBER MONTHS... 1 WEEKS... 2 DAYS... 3 LESS THAN ONE DAY (24 HOURS)... 4 DON T KNOW
94 D3. During the past 12 months, did you use any of the following to try to stop smoking tobacco? READ EACH ITEM: YES NO a. Counseling, including at a smoking cessation clinic? b. Nicotine replacement therapy, such as the patch or gum? c. Other prescription medications that are non-traditional medicines? d. Traditional herb medicines/acupuncture? e. A quit line or a smoking telephone support line? f. Switching to smokeless tobacco? ff. Electro smoke g. Anything else? Specify: D4. Have you visited a doctor or other health care provider in the past 12 months? YES... 1 NO... 2 SKIP TO D8 D5. How many times did you visit a doctor or health care provider in the past 12 months? Would you say 1 or 2 times, 3 to 5 times, or 6 or more times? 1 OR TO OR MORE... 3 D6. During any visit to a doctor or health care provider in the past 12 months, were you asked if you smoke tobacco? YES... 1 NO... 2 SKIP TO D8 68
95 D7. During any visit to a doctor or health care provider in the past 12 months, were you advised to quit smoking tobacco? YES... 1 NO... 2 D8. Which of the following best describes your thinking about quitting smoking? I am planning to quit within the next month, I am thinking about quitting within the next 12 months, I will quit someday but not within the next 12 months, or I am not interested in quitting? QUIT WITHIN THE NEXT MONTH... 1 THINKING WITHIN THE NEXT 12 MONTHS... 2 QUIT SOMEDAY, BUT NOT NEXT 12 MONTHS... 3 NOT INTERESTED IN QUITTING... 4 DON T KNOW
96 SECTION E. SECONDHAND SMOKE INTRO: I would now like to ask you a few questions about smoking in various places. E1. Which of the following best describes the rules about smoking inside of your home: Smoking is allowed inside of your home, smoking is generally not allowed inside of your home but there are exceptions, smoking is never allowed inside of your home, or there are no rules about smoking in your home? ALLOWED... 1 NOT ALLOWED, BUT EXCEPTIONS... 2 NEVER ALLOWED... 3 SKIP TO E4 NO RULES... 4 SKIP TO E3 DON T KNOW... 7 SKIP TO E3 E2. Inside your home, is smoking allowed in every room? YES... 1 NO... 2 DON T KNOW... 7 E3. How often does anyone smoke inside your home? Would you say daily, weekly, monthly, less than monthly, or never? DAILY... 1 WEEKLY... 2 MONTHLY... 3 LESS THAN MONTHLY... 4 NEVER... 5 DON T KNOW
97 E4. Do you currently work outside of your home? YES... 1 NO/DON T WORK... 2 SKIP TO E9 E5. Do you usually work indoors or outdoors? INDOORS... 1 SKIP TO E7 OUTDOORS... 2 BOTH... 3 SKIP TO E7 E6. Are there any indoor areas at your work place? YES... 1 NO... 2 SKIP TO E9 DON T KNOW... 7 SKIP TO E9 E7. Which of the following best describes the indoor smoking policy where you work: Smoking is allowed anywhere, smoking is allowed only in some indoor areas, smoking is not allowed in any indoor areas, or there is no policy? ALLOWED ANYWHERE... 1 ALLOWED ONLY IN SOME INDOOR AREAS... 2 NOT ALLOWED IN ANY INDOOR AREAS... 3 THERE IS NO POLICY... 4 DON T KNOW... 7 E8. During the past 30 days, did anyone smoke in indoor areas where you work? YES... 1 NO... 2 DON T KNOW
98 E9. During the past 30 days, did you visit any government buildings or government offices (at where government employees work)? YES... 1 NO... 2 SKIP TO EE11a DON T KNOW... 7 SKIP TO EE11a E10. Did anyone smoke inside of any government buildings or government offices (at where government employees work) that you visited in the past 30 days? YES... 1 NO... 2 DON T KNOW... 7 EE11a. During the past 30 days, did you visit any private/village clinic? YES... 1 NO... 2 SKIP TO EE11b DON T KNOW... 7 SKIP TO EE11b EE12a. Did anyone smoke inside of any private/village clinic that you visited in the past 30 days? YES... 1 NO... 2 DON T KNOW... 7 EE11b. During the past 30 days, did you visit any township hospital or community health service center? YES... 1 NO... 2 SKIP TO EE11c DON T KNOW... 7 SKIP TO EE11c EE12b. Did anyone smoke inside of any township hospital or community health service center that you visited in the past 30 days? YES... 1 NO... 2 DON T KNOW
99 EE11c. During the past 30 days, did you visit other health care facilities? YES... 1 NO... 2 SKIP TO E13 DON T KNOW... 7 SKIP TO E13 EE12c. Did anyone smoke inside of other health care facilities that you visited in the past 30 days? YES... 1 NO... 2 DON T KNOW... 7 E13. During the past 30 days, did you visit any restaurants? YES... 1 NO... 2 SKIP TO E15 DON T KNOW... 7 SKIP TO E15 E14. Did anyone smoke inside of any restaurants that you visited in the past 30 days? YES... 1 NO... 2 DON T KNOW... 7 E15. During the past 30 days, did you use any public transportation? YES... 1 NO... 2 SKIP TO E19 DON T KNOW... 7 SKIP TO E19 E16. Did anyone smoke inside of any public transportation that you used in the past 30 days? YES... 1 NO... 2 DON T KNOW... 7 E19. During the past 30 days, did you visit any schools? YES... 1 NO... 2 SKIP TO EE20 DON T KNOW... 7 SKIP TO EE20 73
100 E20. Did anyone smoke inside of any schools that you visited in the past 30 days? YES... 1 NO... 2 DON T KNOW... 7 EE20. In a typical week, how many days are you exposed to smoking (i.e. secondhand smoking exposure)? Would you say Almost every day... 1 Over three days per week days per week... 3 None... 4 DON T KNOW... 7 E17. Based on what you know or believe, does breathing other people s smoke cause serious illness in non-smokers? YES... 1 NO... 2 DON T KNOW... 7 E18. [ONLY ADMINISTERED IF E17 = YES] Based on what you know or believe, does breathing smoke from other people's cigarettes cause any of the following? DON T READ EACH ITEM: YES NO KNOW a. Heart disease in adults? b. Lung illnesses in children? c. Lung cancer in adults?
101 SECTION F. ECONOMICS MANUFACTURED CIGARETTES INT: CHECK THE ANSWERS TO B1, B6a, AND B10a. RECORD BELOW: B1 = B6a = B10a = IF B1 = 1 OR 2 (RESPONDENT CURRENTLY SMOKES DAILY OR LESS THAN DAILY) AND [B6a OR B10a] > 0 OR = 888 (RESPONDENT SMOKES MANUFACTURED CIGARETTES) THEN CONTINUE WITH THIS SECTION 1 OTHERWISE, SKIP TO NEXT SECTION 2 FF1. In the last 30 days, the cigarettes you smoked mainly were bought by yourself or were given to you from others? BY YOURSELF 1 FROM OTHERS 2 HALF, HALF 3 DON T KNOW 7 INTRO: The next few questions are about the last time you purchased cigarettes for yourself. F1. The last time you bought cigarettes for yourself, how many cigarettes did you buy? INTERVIEWER: ENTER UNIT AND NUMBER CIGARETTES... 1 PACKS... 2 How many cigarettes were in each pack? CARTONS... 3 How many cigarettes were in each carton? OTHER SPECIFY:.. 4 How many cigarettes were in each [FILL]? NEVER BOUGHT CIGARETTES... 5 SKIP TO NEXT SECTION 75
102 F2. In total, how much money did you pay for this purchase? INTERVIEWER: IF DON T KNOW, ENTER 9999 Yuan F3. What brand did you buy the last time you purchased cigarettes for yourself? BAISHA 1 HONGHE 2 HUANGGUOSHU 3 HONGMEI 4 HONGJINLONG 5 HONGQIQU 6 YUNYAN 7 HONGSHANCHA 8 HONGTASHAN 9 SHISHI 10 ZHONGHUA 11 YUXI 12 FURONGWANG 13 LANZHOU 14 NANJING 15 LIQUN 16 JINSIHOU 17 ZHONGNANHAI 18 HONGSHUANGXI 19 SHUANGXI 20 PINGTANG 21 YESHU 22 JIQING 23 OTHERS, SPECIFY 77 F4. The last time you purchased cigarettes for yourself, where did you buy them? KIOSKS/GAS STATION/CONVENIENCE 1 DUTY-FREE SHOP 2 BAR/ENTERTAINMENT VENUES 3 76
103 TOBACCO STORE/LIQUOR STORE 4 INTERNET 5 HOTEL 6 STORE/SUPERMARKET 7 STREET VENDOR 8 VENDING MACHINE 9 OUTSIDE THE COUNTRY 10 OTHER 11 specify DON T REMEMBER 77 77
104 SECTION G. MEDIA INTRO: The next few questions ask about your exposure to the media and advertisements in the last 30 days. G1. In the last 30 days, have you noticed information about the dangers of smoking cigarettes or that encourages quitting in any of the following places? NOT READ EACH ITEM: YES NO APPLICABLE a. In newspapers or in magazines? b. On television? c. On the radio? d. On billboards? e. On posters or promotion material f. On public walls g. In cinemas h. On the internet i. On public transportation vehicles or stations j. Somewhere else? Specify: G2. In the last 30 days, did you notice any health warnings on cigarette packages? YES... 1 NO... 2 SKIP TO G4 DID NOT SEE ANY CIGARETTE PACKAGES... 3 SKIP TO G4 78
105 G3. [ADMINISTER IF B1 = 1 OR 2. ELSE GO TO G4] In the last 30 days, have warning labels on cigarette packages led you to think about quitting? YES... 1 NO... 2 DON T KNOW... 7 G4. In the last 30 days, have you noticed any advertisements or signs promoting cigarettes in the following places? NOT READ EACH ITEM: YES NO APPLICABLE a. In stores where cigarettes are sold? b. On television? c. On the radio? d. On billboards? e. On posters or promotion material? f. In newspapers or magazines? g. In cinemas? h. On the internet? i. On public transportation vehicles or stations? j. On public walls? k. Anywhere else? Specify: G5. In the last 30 days, have you noticed any sport or sporting event that is associated with cigarette brands or cigarette companies? YES... 1 NO... 2 DON T KNOW
106 GG5. In the last 30 days, have you noticed any music, theatre, art, or fashion events that are associated with cigarette brands or cigarette companies? YES... 1 NO... 2 DON T KNOW... 7 G6. In the last 30 days, have you noticed any of the following types of cigarette promotions? DON T READ EACH ITEM: YES NO KNOW a. Free samples of cigarettes? b. Cigarettes at sale prices? c. Coupons for cigarettes? d. Free gifts or special discount offers on other products when buying cigarettes? e. Clothing or other items with a cigarette brand name or logo? f. Cigarette promotions in the mail? g. Single sales?
107 SECTION H. KNOWLEDGE, ATTITUDES & PERCEPTIONS H1. Based on what you know or believe, does smoking tobacco cause serious illness? YES... 1 NO... 2 SKIP TO HC3 DON T KNOW... 7 H2. Based on what you know or believe, does smoking tobacco cause the following DON T READ EACH ITEM: YES NO KNOW a. Stroke (blood clots in the brain that may cause paralysis)? b. Heart attack? c. Lung cancer? HC3. Do you agree that cigarettes which are marked with lower tar are less harmful than general cigarettes? AGREE... 1 DISAGREE... 2 DON T KNOW/DON T SURE
108 END INDIVIDUAL QUESTIONNAIRE I00. Those are all of the questions I have. Thank you very much for partcipating in this important survey. I01. IS THIS INVESTIGATION USING INTERPRETATION? YES... 1 NO... 2 I02. RECORD ANY NOTES ABOUT INTERVIEW: 82
109 Appendix B: Sample Design The Global Adults Tobacco Survey in China (GATS China) used a multistage stratified cluster sampling design. The target population was all noninstitutional men and women 15 years and older living in China. The country was stratified by six regions (North, Northeast, East, Central and South, Northwest,andSouthwest)andurban/ruralattheprimarysamplingunitlevel,making12strataintotal. Atthefirststageofsampling,theprimarysamplingunit(PSU)wasacountyforaruralareaanda districtforanurbanarea.thesamplingframewasalistofthecounties/countylevelcities/districtswith thenumberofhouseholdsadministeredbytheministryofpublicsecurity(mps),china,in2007.the ruralstratumcontainedcountiesandthecountylevelcitiesandurbanstratumcontaineddistricts.the totalnumberof100psu swasproportionatelyallocatedtoeachofsixregionsaccordingtothenumber ofhouseholdsandthenequallyallocatedtourbanandruralstratawithineachregion.theprobability proportionaltosize(pps)samplingmethodwasusedtoselectpsu s.thesizeofmeasureisthenumber ofhouseholdsdocumentedinthempsdata. Atthesecondstagesampling,thesecondarysamplingunit(SSU)wasavillageinruralareaanda neighborhood committee in urban areas. Two SSU s were selected from the selected PSU using PPS sampling method. The size of measure was the number of households in a village/neighborhood committee.theselectedssuwaspartitionedintosegmentsofabout1000householdsasneeded.one segmentwasrandomlyselected.fromeachselectedsegment,75householdswereselectedwithsimple random sampling. The total number of designated households was 15,000. One eligible household memberfromeachselectedhouseholdwasthenrandomlychosenforaninterview. The selection probability of an eligible individual was calculated as the product of selection probabilityofpsu,selectionprobabilityofssu,oneoverthenumberofsegments,75overthenumber ofhouseholdsinthepreviouslyselectedsegment,andoneoverthenumberofalleligiblehousehold members.thesamplingbaseweightforaneligibleindividualwastheinverseoftheselectionprobability showedabove. The base weights were adjusted for nonresponse related to two factors: household level nonresponseadjustments,andpersonlevelnonresponseadjustments.householdlevelnonresponse adjustmentsweremadewithinthepsu.thecorrespondinghouseholdlevelweightingclassadjustment were computed as one divided by the weighted household response rate for the sample PSU. The 83
110 personlevel response rate was computed as one divided by the weighted individual response rate within strategically formed subgroups: region, urban or rural at PSU level, gender, age group, and smoking status. The overall adjustments for nonresponse were the product of the adjustments at householdlevelandpersonlevel.thepopulationofpeopleage15andolderin2008,asestimatedby thenationalbureauofstatistics,byregion,urban/ruralatpsulevel,genderandagegroupwereused for poststratification calibration adjustment. The final weight assigned to each responding unit was computedastheproductofthebaseweight,thenonresponseadjustmentsandthepoststratification collaborationadjustmentandwasusedinallanalysestoproduceestimatesofpopulationparameters. 84
111 Appendix C: Estimates of Sampling Errors 85
112 AppendixC1:SamplingErrorofkeyindicatorsforoveralladults 15yearsandover. Weighted Standard Lower Upper Sample Countin Design Relative Indicator Estimate Error Limit Limit size 1000s Effect Error CurrentTobaccoSmoker , , CurrentCigaretteSmokers , , CurrentManufacturedCigaretteSmokers , , CurrentHandrolledCigaretteSmokers ,354 24, CurrentSmokerofOtherTobaccoProducts ,354 9, DailyTobaccoSmoker , , DailyCigaretteSmokers , , FormerDailyTobaccoSmokersAmongAllAdults ,354 39, FormerTobaccoSmokersAmongEverDailySmokers ,306 39, SmokingQuitAttemptinthePast12Months ,706 44, VisitedaHealthCareProviderinthePast12Months ,132 93, HealthCareProviderAskedaboutSmoking ,458 37, HealthCareProviderAdvisedQuittingSmoking ,458 31, UseofPharmacotherapyforSmokingCessation , UseofCounseling/AdviceorQuitLinesforSmokingCessation , UseofElectrosmokeforSmokingCessation ExposuretoSecondhandSmokeatWork , , AdultsExposedtoSecondhandSmokeatHomeatLeastMonthly , , AwareofTobaccoSmokeinGovernmentBuildingsAmongWho Went ,316 61, AwareofTobaccoSmokeinPrivate/VillageClinicsAmongWhoWent ,849 75, AwareofTobaccoSmokeinTownshipHospitalorCommunityHealth CenterAmongWhoWent ,619 38, AwareofTobaccoSmokeinOtherHealthCareFacilitiesAmongWho Went ,734 43, AwareofTobaccoSmokeinRestaurantsAmongWhoWent , ,
113 AwareofTobaccoSmokeonPublicTransportationAmongWho Went , , AwareofTobaccoSmokeinSchoolsAmongWhoWent ,510 85, NoticedAntiSmokingInformationinNewspapersorinMagazines , , NoticedAntiSmokingInformationonTV , , NoticedAntiSmokingInformationonRadio ,350 64, NoticedAntiSmokingInformationonTVorRadio , , NoticedAntiSmokingInformationonBillboards , , NoticedAntiSmokingInformationonPosters/PromotionMaterial , , NoticedAntiSmokingInformationonPublicWalls , ,
114 AppendixC1(cont.):SamplingErrorofkeyindicatorsforoveralladults 15yearsandover. Weighted Standard Lower Upper Sample Countin Design Relative Indicator Estimate Error Limit Limit size 1000s Effect Error NoticedAntiSmokingInformationinCinemas ,349 24, NoticedAntiSmokingInformationontheInternet ,349 86, NoticedAntiSmokingInformationonPublicTransportation , , NoticedAntiSmokingInformationSomewhereElse ,332 28, NoticedAntiSmokingInformationatAnyLocation , , NoticedHealthWarningLabelsonCigarettePackages , , ThinkingAboutQuittingBecauseofWarningLabelsonPackages ,999 94, NoticedCigaretteAdvertisementsinStores ,345 43, NoticedCigaretteAdvertisementsonTV ,348 79, NoticedCigaretteAdvertisementsontheRadio ,348 7, NoticedCigaretteAdvertisementsonBillboards ,349 45, NoticedCigaretteAdvertisementsonPosters ,347 24, NoticedCigaretteAdvertisementsinNewspapersorinMagazines ,349 25, NoticedCigaretteAdvertisementsinCinemas , NoticedCigaretteAdvertisementsontheInternet ,346 15, NoticedCigaretteAdvertisingonPublicTransportation ,348 12, NoticedCigaretteAdvertisingonPublicWalls ,349 18, NoticedCigaretteAdvertisingSomewhereElse ,325 3, NoticedSponsorshipofSportorSportingEvent ,344 37, NoticedCigaretteBrandsAssociatedwithMusic,ArtorFashion ,340 12, NoticedCigarettePromotionsFreeSamples ,346 5, NoticedCigarettePromotionsSales ,345 8, NoticedCigarettePromotionsCoupons , NoticedCigarettePromotionsFreeGifts/DiscountsonOther Products ,346 10, NoticedCigarettePromotionsitemwithBrandNameorLogo ,346 14,
115 NoticedCigarettePromotionsMailPromotions , NoticedCigarettePromotionsSingleSales ,345 24, NoticedAnyAdvertisement,SponsorshiporPromotion , , BelievesthatTobaccoSmokingCausesSeriousIllness , , BelievesthatTobaccoSmokingCausesStrokes , , BelievesthatTobaccoSmokingCausesHeartAttacks , , BelievesthatTobaccoSmokingCausesLungCancer , , BelievesthatSecondhandSmokeCausesSeriousIllnessin NonSmokers , ,
116 AppendixC2:Samplingerrorofkeyindicatorsformales 15yearsandover. Weighted Standard Lower Upper Sample Countin Design Relative Indicator Estimate Error Limit Limit size 1000s Effect Error CurrentTobaccoSmoker , , CurrentCigaretteSmokers , , CurrentManufacturedCigaretteSmokers , , CurrentHandrolledCigaretteSmokers ,603 21, CurrentSmokerofOtherTobaccoProducts ,603 8, DailyTobaccoSmoker , , DailyCigaretteSmokers , , FormerDailyTobaccoSmokersAmongAllAdults ,603 37, FormerTobaccoSmokersAmongEverDailySmokers ,048 37, SmokingQuitAttemptinthePast12Months ,608 42, VisitedaHealthCareProviderinthePast12Months ,878 87, HealthCareProviderAskedaboutSmoking ,348 36, HealthCareProviderAdvisedQuittingSmoking ,348 30, UseofPharmacotherapyforSmokingCessation , UseofCounseling/AdviceorQuitLinesforSmokingCessation , UseofElectrosmokeforSmokingCessation ExposuretoSecondhandSmokeatWork , , AdultsExposedtoSecondhandSmokeatHomeatLeastMonthly , , AwareofTobaccoSmokeinGovernmentBuildingsAmongWho Went , AwareofTobaccoSmokeinPrivate/VillageClinicsAmongWhoWent ,285 36, AwareofTobaccoSmokeinTownshipHospitalorCommunityHealth CenterAmongWhoWent , AwareofTobaccoSmokeinOtherHealthCareFacilitiesAmongWho Went , AwareofTobaccoSmokeinRestaurantsAmongWhoWent , ,
117 AwareofTobaccoSmokeonPublicTransportationAmongWho Went , , AwareofTobaccoSmokeinSchoolsAmongWhoWent ,149 52, NoticedAntiSmokingInformationinNewspapersorinMagazines , , NoticedAntiSmokingInformationonTV , , NoticedAntiSmokingInformationonRadio ,601 37, NoticedAntiSmokingInformationonTVorRadio , , NoticedAntiSmokingInformationonBillboards , , NoticedAntiSmokingInformationonPosters/PromotionMaterial ,599 61, NoticedAntiSmokingInformationonPublicWalls , ,
118 AppendixC2(cont.):Samplingerrorofkeyindicatorsformales 15yearsandover. Weighted Standard Lower Upper Sample Countin Design Relative Indicator Estimate Error Limit Limit size 1000s Effect Error NoticedAntiSmokingInformationinCinemas ,600 14, NoticedAntiSmokingInformationontheInternet ,600 52, NoticedAntiSmokingInformationonPublicTransportation , , NoticedAntiSmokingInformationSomewhereElse ,594 17, NoticedAntiSmokingInformationatAnyLocation , , NoticedHealthWarningLabelsonCigarettePackages , , ThinkingAboutQuittingBecauseofWarningLabelsonPackages ,761 91, NoticedCigaretteAdvertisementsinStores ,599 28, NoticedCigaretteAdvertisementsonTV ,600 44, NoticedCigaretteAdvertisementsontheRadio ,600 4, NoticedCigaretteAdvertisementsonBillboards ,600 29, NoticedCigaretteAdvertisementsonPosters ,600 14, NoticedCigaretteAdvertisementsinNewspapersorinMagazines ,600 16, NoticedCigaretteAdvertisementsinCinemas , NoticedCigaretteAdvertisementsontheInternet ,599 11, NoticedCigaretteAdvertisingonPublicTransportation ,599 6, NoticedCigaretteAdvertisingonPublicWalls ,600 11, NoticedCigaretteAdvertisingSomewhereElse ,591 2, NoticedSponsorshipofSportorSportingEvent ,598 25, NoticedCigaretteBrandsAssociatedwithMusic,ArtorFashion ,596 8, NoticedCigarettePromotionsFreeSamples ,600 4, NoticedCigarettePromotionsSales ,600 4, NoticedCigarettePromotionsCoupons , NoticedCigarettePromotionsFreeGifts/DiscountsonOther Products ,600 7, NoticedCigarettePromotionsitemwithBrandNameorLogo ,600 9,
119 NoticedCigarettePromotionsMailPromotions , NoticedCigarettePromotionsSingleSales ,599 16, NoticedAnyAdvertisement,SponsorshiporPromotion , , BelievesthatTobaccoSmokingCausesSeriousIllness , , BelievesthatTobaccoSmokingCausesStrokes , , BelievesthatTobaccoSmokingCausesHeartAttacks , , BelievesthatTobaccoSmokingCausesLungCancer , , BelievesthatSecondhandSmokeCausesSeriousIllnessin NonSmokers , ,
120 AppendixC3:Samplingerrorofkeyindicatorsforfemales 15yearsandover. Weighted Standard Lower Upper Sample Countin Design Relative Indicator Estimate Error Limit Limit size 1000s Effect Error CurrentTobaccoSmoker ,751 12, CurrentCigaretteSmokers ,751 12, CurrentManufacturedCigaretteSmokers ,751 10, CurrentHandrolledCigaretteSmokers ,751 2, CurrentSmokerofOtherTobaccoProducts , DailyTobaccoSmoker ,751 10, DailyCigaretteSmokers ,751 9, FormerDailyTobaccoSmokersAmongAllAdults ,751 2, FormerTobaccoSmokersAmongEverDailySmokers , SmokingQuitAttemptinthePast12Months , VisitedaHealthCareProviderinthePast12Months , HealthCareProviderAskedaboutSmoking , HealthCareProviderAdvisedQuittingSmoking , UseofPharmacotherapyforSmokingCessation UseofCounseling/AdviceorQuitLinesforSmokingCessation UseofElectrosmokeforSmokingCessation ExposuretoSecondhandSmokeatWork ,745 89, AdultsExposedtoSecondhandSmokeatHomeatLeastMonthly , , AwareofTobaccoSmokeinGovernmentBuildingsAmongWho Went , AwareofTobaccoSmokeinPrivate/VillageClinicsAmongWhoWent ,564 39, AwareofTobaccoSmokeinTownshipHospitalorCommunityHealth CenterAmongWhoWent , AwareofTobaccoSmokeinOtherHealthCareFacilitiesAmongWho Went , AwareofTobaccoSmokeinRestaurantsAmongWhoWent , ,
121 AwareofTobaccoSmokeonPublicTransportationAmongWho Went ,316 81, AwareofTobaccoSmokeinSchoolsAmongWhoWent ,361 33, NoticedAntiSmokingInformationinNewspapersorinMagazines ,748 98, NoticedAntiSmokingInformationonTV , , NoticedAntiSmokingInformationonRadio ,749 26, NoticedAntiSmokingInformationonTVorRadio , , NoticedAntiSmokingInformationonBillboards ,749 97, NoticedAntiSmokingInformationonPosters/PromotionMaterial ,749 52, NoticedAntiSmokingInformationonPublicWalls ,748 82,
122 AppendixC3(cont.):Samplingerrorofkeyindicatorsforfemales 15yearsandover. Weighted Standard Lower Upper Sample Countin Design Relative Indicator Estimate Error Limit Limit size 1000s Effect Error NoticedAntiSmokingInformationinCinemas ,749 9, NoticedAntiSmokingInformationontheInternet ,749 34, NoticedAntiSmokingInformationonPublicTransportation ,747 95, NoticedAntiSmokingInformationSomewhereElse ,738 11, NoticedAntiSmokingInformationatAnyLocation , , NoticedHealthWarningLabelsonCigarettePackages , , ThinkingAboutQuittingBecauseofWarningLabelsonPackages , NoticedCigaretteAdvertisementsinStores ,746 15, NoticedCigaretteAdvertisementsonTV ,748 34, NoticedCigaretteAdvertisementsontheRadio ,748 3, NoticedCigaretteAdvertisementsonBillboards ,749 16, NoticedCigaretteAdvertisementsonPosters ,747 9, NoticedCigaretteAdvertisementsinNewspapersorinMagazines ,749 9, NoticedCigaretteAdvertisementsinCinemas , NoticedCigaretteAdvertisementsontheInternet ,747 3, NoticedCigaretteAdvertisingonPublicTransportation ,749 5, NoticedCigaretteAdvertisingonPublicWalls ,749 6, NoticedCigaretteAdvertisingSomewhereElse , NoticedSponsorshipofSportorSportingEvent ,746 11, NoticedCigaretteBrandsAssociatedwithMusic,ArtorFashion ,744 3, NoticedCigarettePromotionsFreeSamples ,746 1, NoticedCigarettePromotionsSales ,745 3, NoticedCigarettePromotionsCoupons , NoticedCigarettePromotionsFreeGifts/DiscountsonOther Products ,746 2, NoticedCigarettePromotionsitemwithBrandNameorLogo ,746 4,
123 NoticedCigarettePromotionsMailPromotions , NoticedCigarettePromotionsSingleSales ,746 8, NoticedAnyAdvertisement,SponsorshiporPromotion ,725 78, BelievesthatTobaccoSmokingCausesSeriousIllness , , BelievesthatTobaccoSmokingCausesStrokes , , BelievesthatTobaccoSmokingCausesHeartAttacks , , BelievesthatTobaccoSmokingCausesLungCancer , , BelievesthatSecondhandSmokeCausesSeriousIllnessin NonSmokers , ,
124 AppendixC4:Samplingerrorofkeyindicatorsforurbanadults 15yearsandover. Weighted Standard Lower Upper Sample Countin Design Relative Indicator Estimate Error Limit Limit size 1000s Effect Error CurrentTobaccoSmoker , , CurrentCigaretteSmokers , , CurrentManufacturedCigaretteSmokers , , CurrentHandrolledCigaretteSmokers ,832 3, CurrentSmokerofOtherTobaccoProducts ,832 1, DailyTobaccoSmoker , , DailyCigaretteSmokers , , FormerDailyTobaccoSmokersAmongAllAdults ,832 18, FormerTobaccoSmokersAmongEverDailySmokers ,639 18, SmokingQuitAttemptinthePast12Months , VisitedaHealthCareProviderinthePast12Months ,564 36, HealthCareProviderAskedaboutSmoking , HealthCareProviderAdvisedQuittingSmoking , UseofPharmacotherapyforSmokingCessation UseofCounseling/AdviceorQuitLinesforSmokingCessation UseofElectrosmokeforSmokingCessation ExposuretoSecondhandSmokeatWork , , AdultsExposedtoSecondhandSmokeatHomeatLeastMonthly , , AwareofTobaccoSmokeinGovernmentBuildingsAmongWho Went , AwareofTobaccoSmokeinPrivate/VillageClinicsAmongWhoWent , AwareofTobaccoSmokeinTownshipHospitalorCommunityHealth CenterAmongWhoWent , AwareofTobaccoSmokeinOtherHealthCareFacilitiesAmongWho Went ,160 31, AwareofTobaccoSmokeinRestaurantsAmongWhoWent , ,
125 AwareofTobaccoSmokeonPublicTransportationAmongWho Went ,451 76, AwareofTobaccoSmokeinSchoolsAmongWhoWent ,296 44, NoticedAntiSmokingInformationinNewspapersorinMagazines , , NoticedAntiSmokingInformationonTV , , NoticedAntiSmokingInformationonRadio ,830 34, NoticedAntiSmokingInformationonTVorRadio , , NoticedAntiSmokingInformationonBillboards , , NoticedAntiSmokingInformationonPosters/PromotionMaterial ,829 87, NoticedAntiSmokingInformationonPublicWalls , ,
126 AppendixC4(cont.):Samplingerrorofkeyindicatorsforurbanadults 15yearsandover. Weighted Standard Lower Upper Sample Countin Design Relative Indicator Estimate Error Limit Limit size 1000s Effect Error NoticedAntiSmokingInformationinCinemas ,830 18, NoticedAntiSmokingInformationontheInternet ,830 57, NoticedAntiSmokingInformationonPublicTransportation , , NoticedAntiSmokingInformationSomewhereElse ,825 20, NoticedAntiSmokingInformationatAnyLocation , , NoticedHealthWarningLabelsonCigarettePackages , , ThinkingAboutQuittingBecauseofWarningLabelsonPackages ,521 38, NoticedCigaretteAdvertisementsinStores ,829 24, NoticedCigaretteAdvertisementsonTV ,828 47, NoticedCigaretteAdvertisementsontheRadio ,828 3, NoticedCigaretteAdvertisementsonBillboards ,829 30, NoticedCigaretteAdvertisementsonPosters ,828 18, NoticedCigaretteAdvertisementsinNewspapersorinMagazines ,829 20, NoticedCigaretteAdvertisementsinCinemas , NoticedCigaretteAdvertisementsontheInternet ,828 10, NoticedCigaretteAdvertisingonPublicTransportation ,829 6, NoticedCigaretteAdvertisingonPublicWalls ,829 13, NoticedCigaretteAdvertisingSomewhereElse ,824 2, NoticedSponsorshipofSportorSportingEvent ,829 24, NoticedCigaretteBrandsAssociatedwithMusic,ArtorFashion ,828 7, NoticedCigarettePromotionsFreeSamples ,829 3, NoticedCigarettePromotionsSales ,829 3, NoticedCigarettePromotionsCoupons , NoticedCigarettePromotionsFreeGifts/DiscountsonOther Products ,829 5, NoticedCigarettePromotionsitemwithBrandNameorLogo ,829 4,
127 NoticedCigarettePromotionsMailPromotions , NoticedCigarettePromotionsSingleSales ,828 8, NoticedAnyAdvertisement,SponsorshiporPromotion , , BelievesthatTobaccoSmokingCausesSeriousIllness , , BelievesthatTobaccoSmokingCausesStrokes , , BelievesthatTobaccoSmokingCausesHeartAttacks , , BelievesthatTobaccoSmokingCausesLungCancer *5 5, , BelievesthatSecondhandSmokeCausesSeriousIllnessin NonSmokers *8 5,831 3'),
128 AppendixC5:Samplingerrorofkeyindicatorsforr5raladults 15yearsandover. Weighted Standard Lower Upper Sample Countin Design Relative Indicator Estimate Error Limit Limit size 100s Effect Error CurrentTobaccoSmoker , , CurrentCigaretteSmokers , , CurrentManufacturedCigaretteSmokers , , CurrentHandrolledCigaretteSmokers ,522 20, CurrentSmokerofOtherTobaccoProducts ,522 7, DailyTobaccoSmoker , , DailyCigaretteSmokers , , FormerDailyTobaccoSmokersAmongAllAdults ,522 21, FormerTobaccoSmokersAmongEverDailySmokers ,667 21, SmokingQuitAttemptinthePast12Months ,049 29, VisitedaHealthCareProviderinthePast12Months ,568 56, HealthCareProviderAskedaboutSmoking , HealthCareProviderAdvisedQuittingSmoking , UseofPharmacotherapyforSmokingCessation UseofCounseling/AdviceorQuitLinesforSmokingCessation , UseofElectrosmokeforSmokingCessation ExposuretoSecondhandSmokeatWork ,227 87, AdultsExposedtoSecondhandSmokeatHomeatLeastMonthly , , AwareofTobaccoSmokeinGovernmentBuildingsAmongWho Went , AwareofTobaccoSmokeinPrivate/VillageClinicsAmongWhoWent ,070 58, AwareofTobaccoSmokeinTownshipHospitalorCommunityHealth CenterAmongWhoWent , AwareofTobaccoSmokeinOtherHealthCareFacilitiesAmongWho Went , AwareofTobaccoSmokeinRestaurantsAmongWhoWent , ,
129 AwareofTobaccoSmokeonPublicTransportationAmongWho Went , , AwareofTobaccoSmokeinSchoolsAmongWhoWent ,214 40, NoticedAntiSmokingInformationinNewspapersorinMagazines ,520 83, NoticedAntiSmokingInformationonTV , , NoticedAntiSmokingInformationonRadio ,520 29, NoticedAntiSmokingInformationonTVorRadio , , NoticedAntiSmokingInformationonBillboards ,520 70, NoticedAntiSmokingInformationonPosters/PromotionMaterial ,519 25, NoticedAntiSmokingInformationonPublicWalls ,519 59,
130 AppendixC5(cont.):Samplingerrorofkeyindicatorsforruraladults 15yearsandover. Weighted Standard Lower Upper Sample Countin Design Relative Indicator Estimate Error Limit Limit size 1000s Effect Error NoticedAntiSmokingInformationinCinemas ,519 5, NoticedAntiSmokingInformationontheInternet ,519 28, NoticedAntiSmokingInformationonPublicTransportation ,519 84, NoticedAntiSmokingInformationSomewhereElse ,507 8, NoticedAntiSmokingInformationatAnyLocation , , NoticedHealthWarningLabelsonCigarettePackages , , ThinkingAboutQuittingBecauseofWarningLabelsonPackages ,478 55, NoticedCigaretteAdvertisementsinStores ,516 19, NoticedCigaretteAdvertisementsonTV ,520 31, NoticedCigaretteAdvertisementsontheRadio ,520 4, NoticedCigaretteAdvertisementsonBillboards ,520 14, NoticedCigaretteAdvertisementsonPosters ,519 5, NoticedCigaretteAdvertisementsinNewspapersorinMagazines ,520 4, NoticedCigaretteAdvertisementsinCinemas , NoticedCigaretteAdvertisementsontheInternet ,518 4, NoticedCigaretteAdvertisingonPublicTransportation ,519 5, NoticedCigaretteAdvertisingonPublicWalls ,520 5, NoticedCigaretteAdvertisingSomewhereElse , NoticedSponsorshipofSportorSportingEvent ,515 12, NoticedCigaretteBrandsAssociatedwithMusic,ArtorFashion ,512 5, NoticedCigarettePromotionsFreeSamples ,517 1, NoticedCigarettePromotionsSales ,516 4, NoticedCigarettePromotionsCoupons , NoticedCigarettePromotionsFreeGifts/DiscountsonOther Products ,517 5, NoticedCigarettePromotionsitemwithBrandNameorLogo ,517 9,
131 NoticedCigarettePromotionsMailPromotions , NoticedCigarettePromotionsSingleSales ,517 16, NoticedAnyAdvertisement,SponsorshiporPromotion ,489 90, BelievesthatTobaccoSmokingCausesSeriousIllness , , BelievesthatTobaccoSmokingCausesStrokes , , BelievesthatTobaccoSmokingCausesHeartAttacks , , BelievesthatTobaccoSmokingCausesLungCancer , , BelievesthatSecondhandSmokeCausesSeriousIllnessin NonSmokers , ,
132 Appendix D: Technical and Survey Staff StaffatSites Beijing ZhongDong YingZhou KunQi XiChengDistrict DongZhang ChenhuiBao XiaChen ZhihuaWang ZhengWang XinWang HuiminTian HebeiProvince JixinSun JifeiMa YunXin XichenYang ZhipingZuo NongLi FengrunDistrictofTangshan ZhenrongLiu LijuanTang RuigengLiu KaipingDistrictofTangshan WeiDeng XuewenZhang LipingNian GaobeidianofBaoding YanfangXu DongWei YashuangWang ZhenhuaSu XushuiCountyofBaoding DeyuanHan ZhihuaLiu JianguoLi FushengShi YuhuaDstrictofShijiazhuang LijuanZhang HaoSun YanhuaShen XingyanZhang XingtangCountyofShijiazhuang XinzhongGai MingzheGai YunaQie XianCountyofCangzhou ZhongjieLi ZhandongZhang XiaozheHuang WenruiZhang ShanxiProvince ZepingRen TiyunJia LijieWang ChenglianLi YingzeDistrictofTaiyuan ShuyunGuo TanxiangLi NaCai WanbolinDistrictofTaiyuan RunsuoZhao XiaohongYan HuiWang ShuangzhiHuo YangchengCounty XiaohongYang DongfengQu XiaoxianZhang HaiyanPan Gaoping QiuwangZhang HaiRongZhang LinFangLi YanhuDistrictofYuncheng HongmeiLi XialiZhang LiqingLu YaliLi InnerMongoliaAutonomousRegion HailingWang YonggangQian HaikuanDu FubaoBo XiaopingLiu ShulingWang GuoqiangZhao GuiqinZhao SongshanDistrict ZhongyiHan LiHe LijuWang MinghuaZhang SoilRightBanner.ofHuhehaote XiaopingLiu LianyingDong YeWang JinsuoLi HaibowanDistrictofWuhai ShulingWang HongjuPan GuoqiangZhao LiaoningProvince YahuiHe BaiCheng JunWu HongBoJia DegaoShang WeiFeng Yingkou 106
133 XinLu ZaixingYuan DezhiLin LiangLiu LiliLiu YuhongDistrict YupengYue YanTong DongmeiZhang BingHu WeiyangZhu RunpingYang Donggang FajunChu YuminTian XiaMin XiaoyingShan JilinProvince YajuanWang YingliZhu DongDing ChangxiXu Dehui ZhifangCheng JianXing NanShi YanChen FengmanDistrictofJilin LeiWang YangZhan ChundiJia YiyingMa Yaonan YuhaiZhang ZhiyongHao WeiLu BingZhang Shuangliao GuirongChen LixinRen JingyanLiu JiaLi HeilongjiangProvince XiaojuanShang MeijiaoLi HulanDistrictofHarbin ZhizhuangWang GuoxinZhang LinxinAn YingCong NanshanDistrictofHegang JieSong ShaohuiWu YulinDing WencaiXiao LanxiCountyofSuihua JianfeiZhang YanwenWang YaliZhang HongxiaLi Shanghai HaihongYao SongjiangDistrict NaAn ChunzeXu JianZhu RongCai BaoshanDistrict LaibaoYang JunleiXue HuaZhang HuiyingZhang JiangsuProvince QuanyongXiang YuTan JianSu GuifangZhu MinZhang GulouDistrictofNanjing JiaanSong WeiChen QiangShen XiujuanDeng GulouDistrictofXuzhou YanqiuQi JingLi PanZhang NingZhang HuaiyinDistrictofHuaian YongTang LuoliangLuo DandanZhu JingliangWu XinghuaofTaian ChunMa XiaodongChen XuesongYang ZhengquanZhong DanyangofZhenjiang YuDing ZhongdaHuang HongZheng YunZhou ZhejiangProvince ShuiyangXu YueXu LeiWang HaiyanCounty JianqiangSong JianZheng YaofengCui JunjieXu WestLakeDistrict 107
134 MingShao KaiCao JianguoWu ChunxiaoYan ChanyuYuan YuechengDistrict QiangangZhan LeRen ZhouLu BoChen AnhuiProvince GuopingJi XuefengZhong TaoHong LianzhiZhang DingfuZhang TongguanshanDistrict PingWang ChunlingHe WeimingLou JinshiGao WeiZhou JiliWang MingguangCity JunLi FengShan YongCai GangChen PingLiu HuainingCounty PinglongLi YanZha LibingWang LinLing FujianProvince YuXu JinhuiChen JianqiangBian RuifangLu SanyuanDistrictofSanming RenLi SaiyuLin YiqingHuang YugengZhang YonganofSanming GuangFan LinChen YuanhuaiPeng ChaoqunHuang LichengDistrictofPutian YeChen LirongLin HaihuaRuan RulingZheng MinhoucountyofFuzhou YanZhu GuangxuanYu HangChen JiangxiProvince WeiYan LuJi XingguoCounty YuexingLi JinlianXiao YudongLin LixinLuo ShandongProvince TongSun YiHu TingLiu YunchengCountyofHezeCity WenyunZhang YukunRen FengminWang YanboChe PingduofQingdao BingDai SufangSheng ChengxiangCui XingyuanTao LicangDistrictofQingdao WeiHou ShijunZhou XiujunZhao BingyanLi FeiCountyofLinyi WeichengGuo ChengyongHan FuyingMa DongfangDai HenanProvince WeifengWang BaoZheng YanlingCounty FutianHu HuiYuan ZhenyuRong ZhouminBi HuaiyangCounty JifengQin GengZhang HuijuanLi JinfengFu LushanCounty YayaChen ChunyangZhu HuilianLi ZhechengCounty XinliangCao BingZhang XianweiLi SenHu HubeiProvince QinghuaXia HuihongYu CaidianDistrict 108
135 JianxinGong WeiweiYang YufangDeng FenglanYue ChongyanCounty BaoheChen WeiruiCai GuoqiYe PuWu XinzhouDistrict ShuimingSong ShuishengCai HongpingYang XiangyanDistrict JiahongLi XingwangHuang YanlingYang HongyanMeng HunanProvince GuangchunLi LipingHu XiaorongBai YanhuaCheng QiyongFu HuiGuo YueyanglouDistrict YanfangChen HanYu YanZhang DingchengDistrict YouyuanSong YongDing YouquanZhang ZeminLi XiangtanCounty HonghuiZhou BinWen XiaolianXie ShuipingZhou HongpingXu QiyangCounty ShiqiaoZhu XiangguiYang XiaomaoDeng GuangcuiChen NingyuanCounty XiaolingJiang JunboLei KalinZheng YuhuiZhang GuangdongProvince YanjunXu QiumaoCai RuilinMeng XiaolingLu JunminFang JinenOuyang GuangxinYan XiaokeLian BaiyunDistrictofGuangzhou XinghuaZhang ShengsiZhao ZhanmingHe XuekuiZeng FanyuDistrictofGuangzhou WeiminLao JietingChen YanxinCao JianbinLuo ShundeDistrictof Foshan ZhuowenYu JinenOuyang XiaojunChen HuiyangDistrictofHuizhou XianfuZeng SuoliZhang XiaokeLian DezhiOu HuichengDistrictofHuiyang GuangxinYan GuanghongChen GuangxiZhuangAutonomousRegion SongyiLu ShuiyingLuo XiangshanDistrictofGuilin JieduihuaLi FajuanWang XiaolingLu YanyingQin MashanCounty YuannaLi XiaohanHuang MeilianLu WenyiLuo WumingCounty LipingHe LianzhenLi XuehuiWang LihongHuang BobaiCounty JinxiuChen ShaoqingLing YanhongLi YuChen Chongqing Deqiangmao YanJiao NanchuanDistrict LundiYang GuiZhou XingminYang HongjiangLi HongWei JingChen TongnanCounty 109
136 DayongGuo XiaofengQian JianWang ChengguoLai SichuanProvince XianpingWu YingDeng KuiJi XiaofangChen LiangQiao YaliGao GuanghuiYi YanHe JinjieXia ZhongPeng YonglanWei JiangLiao ChenghuaDistrictofChengdu ChaoWang WeiqinZhou JingZhou ManXu JinniuDistrictofChengdu ShiminPi FangLei XingZhang ZuchongZhong JinjiangDistrictofChengdu LiWang MeiShu ShaChen HongyanYin PujiangCountyofChengdu LongqiDu JunLiu YanZhang WeiChen ShuangliuCountyofChengdu YueyunZhang RongHu WenwenLiu LanlanHuang XinduDistrictofChengdu HuanbingHan XiaofengZhou JiaoJiao YuTan LezhiCountyofZiyang GangHe JinchuanDong LeLiu HuaTang XueLuo BazhouDistrictofBazhong ZhilunWang ZhiZhang XuPeng WeiZhang XingfuLi YibinCountyofYibin LijuanLuo XiaorongLuo DianfeiXi YanYang ZhenlinWu WeiDai CuipingDistrictofYibin WanfangWu MinXie ChunrongPeng QiangLi WeiZhang GuizhouProvince TaoLiu MeihuaXiong LingLi LuxiaLiu MinChen YuntongYao ZhongshanDistrict ZuhuiZhou XiaQin TongrenDistrict JinlianYu JunLiu YiLuo LingWang JinshaCounty JingyunTian JunboHuang ChangxiuPeng ZhangxinSun YunnanProvince CangjiangYang XishanDistrict HongboWang YuanZhou YumeiZhu RuiTao LufengCounty MaoyunLi JianLi HongmeiDuan ZhimeiBi MaguanDistrict RencongYang HuaLuo WeicanLu ShanxiProvince AilingChang RonggangZhang XianqingJiang JiaChen YongMa YiMa XinchengDistrictofXi'an YingYang RuiZhao WenCao YangYang SanyuanCounty XiaoyingMao YingHong 110
137 XiaohuiLu JuanLi YaozhouDistrictofTongchuan AnminShi XiaoyanZhang XuemeiLi RongYang Xingping LaiwangLiu XiaoyuYang YuLuo DengfengZhao FufengCounty BingLv YunliLi BingliZhang WenjuanHan ShangzhouDistrictofShangluo YanpingMa JiaJia ChunyanTian LiyaKou GansuProvince PengfeiGe ChoujiZhang XiaolanRen HaoqiangFan LiCounty ChunyangXi BaomingDu HuipingZhao FangZhao XiaogangPan QinghaiProvince XitaoAi XiaoqunYao MinXing LixiaHe LingHe JingLi MinheCounty WeiminLi HaishanZhu XiaochuanMa JinliangLong ChengxiDistrict HaijianFeng GanshengJia ZengpingChang XueshengJian NingxiaHuiAutonomousRegion LiLi YiYang MingzhiLiu FuminKang WuzhongCity YushanTian SiyanJia WenxiaLiu RunlianZhang XinjiangUygurAutonomousRegion WeiZhang ZhichaoWang Rehemanjiang ShacheCounty YingxianLiu JianjunWang LiZhai LiyaA ToutunheDistrict YajunQin YerkenQukai XiaojingJIa 111
138 Appendix E: Glossary of Abbreviations WHO USCDC ChinaCDC GATS GDP FCTC MPOWER MPS PPS PSUs SSUs Adults TobaccoProducts Smokingfrequency Currentsmoker SHS Prevalence(%) Quitattempt Interestinquitting smoking HCPs WorldHealthOrganization UnitedStatesCentersforDiseaseControlandPrevention ChineseCenterforDiseaseControlandPrevention GlobalAdultTobaccoSurvey GrossDomesticProduct WorldHealthOrganizationFrameworkConventiononTobaccoControl Monitortobaccouseandpreventionpolicies Protectpeoplefromtobaccosmoke Offerhelptoquittobaccouse Warnaboutthedangersoftobacco Enforcebansontobaccoadvertising,promotionandsponsorship Raisetaxesontobacco MinistryofPublicSecurity ProbabilityProportionaltoSize PrimarySamplingUnits SecondarySamplingUnits Populationaged15yearsandover Twotypesoftobaccoproducts; 1)Smokedtobacco:manufacturedcigarettes,handrolledcigarettes,otherssmoked tobaccosuchaspipe,cigar,waterpipe,hookah 2)Smokelesstobacco:snuffbykeepingmouth/nose,chewingtobacco,betelquidwith tobacco Classifiedintothreecategories: 1)Dailysmokingmeanssmokingatleastonetobaccoproducteverydayornearlyevery dayoveraperiodofamonthormore 2)Occasionalsmoking(lessthandaily) 3)Neversmoking(includestriedonceortwiceinlifetime) Dailyoroccasionalsmokerofanytobaccoproduct Secondhandsmoke Statisticalconceptreferredtothenumberofoccurrencesoftobaccousethatare presentinaparticularpopulation,aged15yearsandoveratagiventime Currenttobaccosmokerswhotriedtoquitduringthepast12monthsandformer tobaccosmokerswhohavebeenabstinentfor<12months Currenttobaccosmokerswhoareplanningorthinkingaboutquittingsmokingwithin thenext12months HealthCareProvidersincludevarioushealthprofessionssuchasmedicaldoctors, nurses,pharmacist,healthworkers,etc. 112
139 Exposureto secondhandsmoke Exposureto secondhandsmoke athome Exposureto antismoking information Thinkingofquitting becauseofhealth warningon cigarettespackage Awarenessof cigarettes advertising, promotionand sponsorship Beliefsaboutthe dangersoftobacco smoking Beliefsaboutthe dangersof secondhandsmoke Includessmokingbyrespondentsandsawsomebodysmoke,smelledthesmoke,orsaw tobaccobuttsinside(indoorareas)thepublicplacesduringtheirvisitinthepast30days Emphasizeinsidetherespondent shome,notincludeareasoutsidesuchaspatios, balcony,garden,etc.thatarenotfullyenclosed Respondentswhohavenoticedinformationonvariousmediainthelast30daysabout thedangersofcigarettessmokingandthoseencouragequitting Currenttobaccosmokerswhothoughtaboutquittingsmokinginthelast30days becauseofthehealthwarningoncigarettepacks Respondentswhohavenoticedcigarettesatpointofsale,freegiftsordiscountoffers onotherproductswhenbuycigarettes,oranyadvertisementorsignspromoting cigarettesinstoreswherecigarettesaresoldinthelast30days,orwhohavenoticed anyadvertisementorsignspromotingcigarettesofcigarettescompany,sponsorshipof sportingeventorotherthatinstorewherecigarettesaresoldinthelast30days Respondentswhobelievethattobaccosmokingcausesseriousillnessandspecific diseases,i.e.,stroke,heartattack,lungcancer Respondentswhobelievethatbreathingothersmokecausesseriousillnessandspecific diseaseinnonsmokers,i.e.,heartdiseaseinadults,lungillnessinchildren,lungcancer inadults 113
140 Global Adult Tobacco Survey (GATS) China 2010 Country Report Tables 114
141 Tables 115
142 Table2.1.Summaryofthemethodologyofthe1996,2002,and2010surveys Year Implementingagency ChineseAcademyofPreventive Medicine(formerChinaCDC) ChinaCDC ChinaCDC Targetpopulation Noninstitutionalizedadults aged15yearsandabove Noninstitutionalizedadults aged1569years Noninstitutionalizedadults aged15yearsandabove Samplingdesign Multistageclusterrandom sampling Multistageclusterrandom sampling Multistagestratifiedcluster randomsampling Surveymethod Inhousehold,facetoface, paperpencil Inhousehold,facetoface, paperpencil Inhousehold,facetoface,iPaq handheldadministered Geographiccoverage 145diseasesurveillancepoints in30provinces 145diseasesurveillancepoints in30provinces 50districtsand50countiesin 28provinces Samplesize 123,930 16,056 13,562 Note:Thethreesurveysrefertothe1996NationalPrevalenceSurveyofSmokingPattern,the2002BehaviorRiskFactorSurvey,and GATSChina,
143 Table3.1:Numberandpercentofhouseholdsandpersonsinterviewedandresponseratesbyresidence (unweighted) GATSChina,2010. Urban Residence Number Percent Number Percent Number Percent SelectedHousehold Completed(HC) 5, , , Completed Nooneeligible (HCNE) Incomplete(HINC) Noscreeningrespondent(HNS) Refused(HR) Unoccupied(HUO) , Addressnotadwelling(HAND) Other 1 (HO) TotalHouseholdsSelected 6, , , HouseholdResponseRate(HRR) (%) % 98.76% 97.53% SelectedPerson Completed(PC) 5, , , Incomplete(PINC) Noteligible(PNE) Refused(PR) Incapacitated(PI) Other 1 (PO) TotalNumberofSampledPersons 5, , , PersonlevelResponseRate(PRR) (%) % 98.58% 98.47% TotalResponseRate(TRR)(%) % 97.36% 96.03% 1 OtherincludesNobodyHomeandanyotherresultcodenotlisted. 2 CalculateHouseholdResponseRate(HRR)by: (HC+HCNE)*100 HC+HCNE+HINC+HNS+HR +HO 3 CalculatePersonlevelResponseRate(PRR)by: PC*100 PC+PINC+PR+PI+PO 4 CalculateTotalResponseRate(TRR)by:(HRRxPRR)/100 Notes: Anincompletehouseholdinterview(i.e.,rostercouldnotbefinished)wasconsideredanonrespondenttotheGATS.Thus,thesecases(HINC) werenotincludedinthenumeratorofthehouseholdresponserate. Acompletedpersoninterview[PC]includesrespondentswhohadcompletedatleastquestionE1andwhoprovidedvalidanswersto questionsb1/b2/b3.respondentswhodidnotmeetthesecriteriawereconsideredasincomplete(pinc)nonrespondentstogatsandthus, werenotincludedinthenumeratorofthepersonlevelresponserate. Rural Total 117
144 Table3.2:Distributionofadults15yearsoldbyselecteddemographiccharacteristics GATSChina, Demographic Characteristics Percentage (95%CI 1 ) Weighted NumberofAdults (inthousands) UnweightedNumberof Adults Overall 100 1,068,752 13,354 Gender Male 50.9 (49.0,52.9) 544,452 6,603 Female 49.1 (47.1,51.0) 524,300 6,751 Age(years) (19.3,23.9) 229,512 1, (37.5,41.5) 422,039 5, (27.7,30.8) 312,131 5, (9.1,10.7) 105,071 2,207 Residence Urban 46.1 (35.9,56.6) 492,389 5,832 Rural 53.9 (43.4,64.1) 576,363 7,522 EducationLevel 2 PrimarySchoolorLess 33.3 (30.1,36.7) 279,339 4,966 AttendedSecondarySchool 36.4 (34.1,38.7) 305,039 4,111 HighSchoolGraduate 18.8 (16.7,21.0) 157,424 1,887 CollegeGraduateorAbove 11.6 (9.2,14.5) 97,218 1,239 Occupation AgricultureWorker 31.6 (25.3,38.7) 338,008 5,377 MachineOperator 10.8 (8.7,13.4) 115,740 1,253 BusinessorServiceEmployee 15.7 (13.8,17.7) 167,240 1,694 LeadersofOrganizations 5.2 (4.0,6.8) 55, Clerks 1.7 (1.3,2.3) 18, SpecializedTechnicians 4.0 (3.3,4.9) 42, Medical/HealthPersonnel 1.7 (1.2,2.3) 17, TeachingStaff 1.6 (1.2,2.1) 16, Soldiers 0.1 (0.1,0.2) 1, Students 6.4 (5.3,7.7) 68, NoJobs 11.0 (9.0,13.4) 117,457 1,370 Retired 9.6 (7.8,11.9) 103,009 1,451 Others 0.5 (0.3,1.1) 5, Region East 38.9 (30.0,48.6) 415,285 4,402 Central 27.3 (19.4,37.0) 291,964 3,940 West 33.8 (27.2,41.1) 361,503 5,012 Note:Thefollowingobservationsweremissing:0forage,0forgender,0forresidence,and5foreducation. 1 95%Confidenceinterval. 2 Educationlevelisreportedonlyamongrespondents25+yearsold. 118
145 Table4.1:Percentageandnumberofadults15yearsold,bydetailedsmokingstatusandgender GATSChina,2010. SmokingStatus Overall Male Female Percentage(95%CI) WeightedNumber inthousands Percentage(95%CI) WeightedNumber inthousands Percentage(95%CI) WeightedNumber inthousands Evertobaccosmoker 33.5 (31.7,35.3) 358, (60.4,65.1) 341, (2.5,3.9) 16,393 Currenttobaccosmoker 28.1 (26.7,29.7) 300, (50.6,55.2) 288, (1.9,3.1) 12,603 Dailysmoker 24.1 (22.6,25.7) 257, (42.8,48.0) 246, (1.5,2.6) 10,462 Occasionalsmoker 4.1 (3.5,4.7) 43, (6.6,8.7) 41, (0.2,0.7) 2,141 Occasionalsmoker,formerlydaily 1.2 (1.0,1.6) 13, (1.8,2.9) 12, (0.1,0.2) 628 Occasionalsmoker,neverdaily 2.8 (2.4,3.3) 30, (4.4,6.2) 28, (0.1,0.6) 1,513 Nonsmoker 71.9 (70.3,73.3) 768, (44.8,49.4) 256, (96.9,98.1) 511,698 Note:Currentuseincludesbothdailyandoccasional(lessthandaily)use. *Estimatebasedonlessthan25unweightedcases. 119
146 Table4.2:Percentageandnumberofcurrenttobaccosmokers15yearsold,bydetailedsmokingstatus andgender GATSChina,2010. SmokingStatus Overall Male Female Percentage(95%CI) Currenttobaccosmoker Dailysmoker 85.6 (83.4,87.6) 85.7 (83.4,87.7) 83.0 (72.6,90.0) Occasionalsmoker 14.4 (12.4,16.6) 14.3 (12.3,16.6) 17.0 (10.0,27.4) Occasionalsmoker,formerlydaily 4.4 (3.6,5.5) 4.4 (3.5,5.5) 5.0 (2.9,8.5) Occasionalsmoker,neverdaily 10.0 (8.3,11.9) 9.9 (8.2,11.8) 12.0 (6.3,21.6) 120
147 Table4.3:Percentageandnumberofdailysmokersamongcurrenttobaccosmokers15yearsold,by selecteddemographiccharacteristics GATSChina,2010. Demographic Characteristics PercentageofDailySmokersAmongCurrentSmokers Percentage(95%CI) N Overall 85.6 (83.4,87.6) 4010 Gender Male 85.7 (83.4,87.7) 3772 Female 83.0 (72.6,90.0) 238 Age(years) (72.7,86.7) (80.0,86.0) (87.3,91.8) (84.8,91.7) 590 Residence Urban 84.4 (80.7,87.5) 1522 Rural 86.5 (83.5,89.0) 2488 EducationLevel 1 PrimarySchoolorLess 88.2 (84.0,91.4) 1386 AttendedSecondarySchool 87.6 (84.6,90.0) 1494 HighSchoolGraduate 84.4 (79.1,88.6) 621 CollegeGraduateorAbove 80.6 (73.4,86.1) 327 Occupation AgricultureWorker 87.7 (84.5,90.4) 1756 MachineOperator 86.5 (80.3,90.9) 619 BusinessorServiceEmployee 83.7 (78.1,88.1) 516 LeadersofOrganizations 83.9 (75.6,89.8) 241 Clerks 80.6 (69.7,88.2) 83 SpecializedTechnicians 79.4 (66.7,88.1) 179 Medical/HealthPersonnel 92.7 (73.8,98.3) 27 TeachingStaff 84.8 (58.5,95.6) 40 Soldiers 97.4 (78.5,99.7)* 4 Students 35.8 (8.6,76.8)* 9 NoJobs 85.8 (73.0,93.1) 224 Retired 86.8 (80.7,91.2) 276 Others 75.8 (50.1,90.7) 34 Region East 85.0 (79.5,89.2) 1208 Central 84.5 (80.9,87.6) 1217 West 87.0 (84.5,89.2) Educationlevelisreportedonlyamongrespondents25+yearsold. *Estimatebasedonlessthan25unweightedcases. 121
148 Table4.4:Percentageofcurrentsmokers15yearsoldwhosmokeanycigarettes,andmanufactured cigarettes,byselecteddemographiccharacteristics GATSChina,2010. Demographic Characteristics AnyCigarettes 2 CurrentSmokers 1 WhoSmoke ManufacturedCigarettes Percentage(95%CI) N Percentage(95%CI) N Overall 98.4 (97.0,99.1) 4, (92.9,96.1) 4,010 Gender Male 98.5 (97.4,99.1) 3, (93.7,96.6) 3,772 Female 95.6 (84.9,98.8) (70.3,87.8) 238 Age(years) (97.1,99.9) (97.1,99.9) (98.6,99.8) 1, (97.9,99.4) 1, (95.1,98.8) 1, (87.7,94.1) 1, (89.2,96.6) (72.2,83.9) 590 Residence Urban 99.4 (98.7,99.7) 1, (97.3,99.1) 1,522 Rural 97.6 (95.2,98.8) 2, (89.2,94.2) 2,488 EducationLevel 3 PrimarySchoolorLess 95.4 (91.6,97.5) 1, (78.7,87.5) 1,386 AttendedSecondarySchool 98.9 (97.8,99.5) 1, (94.9,97.7) 1,494 HighSchoolGraduate 99.3 (97.7,99.8) (97.5,99.6) 621 CollegeGraduateorAbove (,) (,) 327 Occupation AgricultureWorker 96.6 (93.4,98.3) 1, (85.1,91.9) 1,756 MachineOperator 99.4 (97.9,99.8) (97.2,99.3) 619 BusinessorServiceEmployee 99.6 (98.2,99.9) (96.1,99.4) 516 Leadersoforganizations 98.9 (95.4,99.8) (95.4,99.8) 241 Clerks (,) (,) 83 SpecializedTechnicians (,) (,) 179 Medical/HealthPersonnel 94.5 (68.3,99.3) (68.3,99.3) 27 TeachingStaff 99.0 (92.8,99.9) (92.8,99.9) 40 Soldiers (,)* (,)* 4 Students (,)* (,)* 9 NoJobs 98.7 (95.1,99.7) (89.5,95.3) 224 Retired 98.7 (96.4,99.5) (89.8,97.2) 276 Others (,) (94.4,99.9) 34 Region East 99.5 (98.5,99.8) 1, (92.4,97.9) 1,208 Central 99.3 (98.3,99.7) 1, (92.3,96.7) 1,217 West 96.6 (92.8,98.4) 1, (89.6,95.9) 1,585 1 Includesdailyandoccasional(lessthandaily)smokers. 2 Includesmanufacturedandhandrolledcigarettes. 3 Educationlevelisreportedonlyamongrespondents25+yearsold. *Estimatebasedonlessthan25unweightedcases. 122
149 Table4.5:Percentageofadults15yearsoldwhoarecurrentsmokersofvarioussmokedtobacco products,bygenderandselecteddemographiccharacteristics GATSChina,2010. DemographicCharacteristics AnySmoked TobaccoProduct AnyCigarette 1 Manufactured Percentage(95%CI) TypeofCigarette Handrolled OtherSmoked Tobacco 2 Overall 28.1 (26.7,29.7) 27.7 (26.2,29.2) 26.7 (25.2,28.2) 2.3 (1.6,3.3) 0.9 (0.6,1.3) Age(years) (14.7,21.6) 17.8 (14.6,21.6) 17.8 (14.6,21.6) 0.3 (0.1,0.9) 0.4 (0.1,1.1) (29.0,33.0) 30.8 (28.8,32.8) 30.6 (28.7,32.7) 1.0 (0.6,1.5) 0.4 (0.2,0.9) (31.6,35.8) 32.8 (30.7,35.0) 30.8 (28.7,32.9) 4.4 (2.9,6.8) 1.2 (0.7,2.1) (20.3,25.3) 21.3 (18.7,24.1) 17.8 (15.6,20.3) 5.6 (4.0,7.7) 2.6 (1.5,4.4) Residence Urban 26.1 (24.0,28.3) 26.0 (23.9,28.2) 25.7 (23.6,28.0) 0.8 (0.5,1.3) 0.4 (0.2,0.6) Rural 29.8 (27.7,32.1) 29.1 (26.9,31.4) 27.5 (25.4,29.6) 3.5 (2.4,5.2) 1.3 (0.8,2.1) EducationLevel 3 PrimarySchoolorLess 24.6 (22.2,27.1) 23.5 (21.2,25.9) 20.5 (18.4,22.9) 5.3 (3.9,7.1) 2.0 (1.2,3.1) AttendedSecondarySchool 36.1 (34.0,38.2) 35.7 (33.7,37.8) 34.9 (32.8,37.0) 2.5 (1.6,4.1) 0.5 (0.3,1.0) HighSchoolGraduate 34.9 (31.6,38.4) 34.6 (31.2,38.2) 34.5 (31.1,38.1) 0.7 (0.4,1.3) 0.7 (0.3,1.9) CollegeGraduateorAbove 26.6 (23.3,30.2) 26.6 (23.3,30.2) 26.6 (23.3,30.2) 0.1 (0.0,0.6) 0.3 (0.1,0.8) Occupation AgricultureWorker 30.7 (27.7,33.8) 29.6 (26.6,32.9) 27.3 (24.3,30.5) 5.0 (3.5,7.0) 1.6 (0.8,2.9) MachineOperator 51.0 (46.1,55.9) 50.7 (45.9,55.5) 50.3 (45.5,55.1) 1.1 (0.6,2.1) 0.6 (0.3,1.2) BusinessorService Employee 29.7 (26.0,33.6) 29.5 (25.9,33.5) 29.2 (25.5,33.2) 1.0 (0.5,1.8) 0.4 (0.2,1.0) Leadersoforganizations 36.2 (30.4,42.5) 35.9 (30.1,42.1) 35.9 (30.1,42.1) 0.2 (0.1,0.5) 0.6 (0.1,2.7) Clerks 35.2 (26.6,45.0) 35.2 (26.6,45.0) 35.2 (26.6,45.0) 0.9 (0.3,2.2) 0.0 (,) SpecializedTechnicians 38.9 (31.0,47.4) 38.9 (31.0,47.4) 38.9 (31.0,47.4) 0.8 (0.3,2.2) 0.1 (0.0,0.6) Medical/HealthPersonnel 16.7 (10.8,24.7) 15.7 (10.1,23.7) 15.7 (10.1,23.7) 2.6 (0.4,16.1) 0.0 (,) TeachingStaff 14.6 (8.9,23.0) 14.5 (8.8,22.8) 14.5 (8.8,22.8) 0.0 (,) 0.1 (0.0,1.0) Soldiers 47.4 (14.7,82.5)* 47.4 (14.7,82.5)* 47.4 (14.7,82.5)* 0.0 (,)* 20.2 (2.8,69.0)* Students 1.2 (0.6,2.7) 1.2 (0.6,2.7) 1.2 (0.6,2.7) 0.0 (,) 0.0 (,) NoJobs 14.4 (10.8,18.9) 14.2 (10.7,18.7) 13.4 (10.1,17.5) 1.8 (1.0,3.0) 0.3 (0.1,0.9) Retired 18.5 (15.3,22.1) 18.2 (15.1,21.9) 17.5 (14.5,20.9) 1.5 (0.8,2.6) 1.3 (0.3,6.5) Others 38.6 (26.9,51.9) 38.6 (26.9,51.9) 38.4 (26.6,51.6) 1.7 (0.5,5.9) 0.3 (0.0,2.2) Region East 26.2 (24.1,28.5) 26.1 (23.9,28.3) 25.2 (23.2,27.3) 2.4 (1.1,5.0) 0.2 (0.1,0.5) Central 28.1 (26.0,30.4) 27.9 (25.8,30.2) 26.7 (24.5,29.0) 2.5 (1.6,3.8) 0.6 (0.3,1.0) West 30.4 (27.1,33.8) 29.3 (26.0,32.8) 28.3 (25.2,31.8) 2.0 (1.2,3.1) 1.9 (1.1,3.1) Note:Currentuseincludesbothdailyandoccasional(lessthandaily)use. 1 Includesmanufacturedandhandrolledcigarettes. 2 Includespipes,cigarsandcigarillos,waterpipes,andothersmokedtobaccoproductsthanmanufacturedandhandrolledcigarettes. 3 Educationlevelisreportedonlyamongrespondents25+yearsold. *Estimatebasedonlessthan25unweightedcases. 123
150 Table4.5(cont.):Percentageofadults15yearsoldwhoarecurrentsmokersofvarioussmoked tobaccoproducts,bygenderandselecteddemographiccharacteristics GATSChina,2010. DemographicCharacteristics AnySmoked TobaccoProduct AnyCigarette 1 Manufactured Percentage(95%CI) TypeofCigarette Handrolled OtherSmoked Tobacco 2 Male 52.9 (50.6,55.2) 52.1 (49.7,54.5) 50.5 (48.2,52.8) 3.9 (2.7,5.8) 1.6 (1.0,2.4) Age(years) (28.0,39.6) 33.5 (27.8,39.6) 33.5 (27.8,39.6) 0.4 (0.1,1.8) 0.7 (0.2,2.0) (55.6,62.8) 59.0 (55.3,62.5) 58.6 (55.0,62.2) 1.8 (1.1,2.8) 0.8 (0.4,1.6) (60.0,65.8) 61.4 (58.4,64.4) 58.2 (54.9,61.5) 7.6 (4.7,12.0) 2.3 (1.3,3.8) (35.8,44.9) 37.9 (33.1,43.0) 31.7 (27.6,36.0) 10.2 (7.2,14.2) 4.7 (2.6,8.5) Residence Urban 49.2 (46.1,52.2) 48.9 (45.9,52.0) 48.5 (45.4,51.6) 1.2 (0.8,2.0) 0.7 (0.4,1.1) Rural 56.1 (52.5,59.6) 54.8 (51.1,58.5) 52.1 (48.7,55.6) 6.2 (4.1,9.3) 2.4 (1.4,3.9) EducationLevel 3 PrimarySchoolorLess 58.9 (54.7,62.9) 56.2 (52.1,60.2) 50.1 (46.0,54.1) 11.8 (8.5,16.2) 4.8 (3.0,7.6) AttendedSecondarySchool 63.2 (60.1,66.2) 62.6 (59.6,65.5) 61.2 (57.9,64.3) 4.4 (2.7,7.1) 0.8 (0.5,1.6) HighSchoolGraduate 58.2 (53.6,62.7) 57.8 (53.0,62.4) 57.6 (52.9,62.3) 1.2 (0.6,2.1) 1.2 (0.4,3.3) CollegeGraduateorAbove 44.0 (38.6,49.5) 44.0 (38.6,49.5) 44.0 (38.6,49.5) 0.2 (0.0,1.1) 0.4 (0.1,1.4) Occupation AgricultureWorker 60.4 (55.1,65.4) 58.4 (53.3,63.4) 54.4 (49.1,59.5) 9.2 (6.4,13.2) 3.0 (1.7,5.4) MachineOperator 67.0 (61.9,71.6) 66.5 (61.7,71.1) 66.0 (61.2,70.5) 1.5 (0.8,2.7) 0.8 (0.4,1.6) BusinessorService Employee 59.1 (53.7,64.3) 58.9 (53.5,64.1) 58.2 (52.7,63.5) 1.9 (1.0,3.4) 0.9 (0.4,2.0) Leadersoforganizations 54.1 (45.0,63.0) 53.5 (44.5,62.3) 53.5 (44.5,62.3) 0.3 (0.1,0.8) 1.0 (0.2,4.2) Clerks 55.5 (40.7,69.5) 55.5 (40.7,69.5) 55.5 (40.7,69.5) 1.2 (0.4,3.4) 0.0 (,) SpecializedTechnicians 52.3 (42.5,62.0) 52.3 (42.5,62.0) 52.3 (42.5,62.0) 1.0 (0.4,3.0) 0.2 (0.0,0.8) Medical/HealthPersonnel 40.4 (27.0,55.4) 38.2 (25.2,53.1) 38.2 (25.2,53.1) 6.4 (0.9,32.8) 0.0 (,) TeachingStaff 36.5 (22.1,53.8) 36.1 (21.8,53.5) 36.1 (21.8,53.5) 0.0 (,) 0.4 (0.0,2.6) Soldiers 47.5 (14.7,82.5)* 47.5 (14.7,82.5)* 47.5 (14.7,82.5)* 0.0 (,)* 20.2 (2.8,69.1)* Students 1.5 (0.5,4.0) 1.5 (0.5,4.0) 1.5 (0.5,4.0) 0.0 (,) 0.0 (,) NoJobs 49.6 (42.6,56.5) 49.3 (42.3,56.3) 47.2 (40.8,53.7) 4.7 (2.8,7.6) 0.9 (0.3,3.1) Retired 38.0 (31.9,44.5) 37.6 (31.4,44.1) 36.1 (30.5,42.0) 2.6 (1.4,5.0) 3.0 (0.6,14.4) Others 55.8 (39.8,70.6) 55.8 (39.8,70.6) 55.4 (39.4,70.3) 1.5 (0.4,5.2) 0.4 (0.1,3.3) Region East 48.7 (45.0,52.4) 48.5 (44.7,52.2) 46.8 (43.3,50.3) 4.4 (2.0,9.2) 0.4 (0.2,0.9) Central 51.4 (48.1,54.7) 51.1 (47.8,54.4) 49.7 (46.1,53.3) 3.6 (2.2,5.6) 1.0 (0.5,1.9) West 59.2 (54.3,64.0) 57.4 (52.4,62.3) 55.6 (50.8,60.3) 3.8 (2.4,5.8) 3.5 (2.1,6.0) Note:Currentuseincludesbothdailyandoccasional(lessthandaily)use. 1 Includesmanufacturedandhandrolledcigarettes. 2 Includespipes,cigarsandcigarillos,waterpipes,andothersmokedtobaccoproductsthanmanufacturedandhandrolledcigarettes. 3 Educationlevelisreportedonlyamongrespondents25+yearsold. *Estimatebasedonlessthan25unweightedcases. 124
151 Table4.5(cont.):Percentageofadults15yearsoldwhoarecurrentsmokersofvarioussmoked tobaccoproducts,bygenderandselecteddemographiccharacteristics GATSChina,2010. DemographicCharacteristics AnySmoked TobaccoProduct AnyCigarette 1 Manufactured Percentage(95%CI) TypeofCigarette Handrolled OtherSmoked Tobacco 2 Female 2.4 (1.9,3.1) 2.3 (1.8,3.0) 1.9 (1.5,2.6) 0.5 (0.4,0.8) 0.1 (0.0,0.4) Age(years) (0.2,1.9) 0.7 (0.2,1.9) 0.7 (0.2,1.9) 0.1 (0.0,0.5) 0.0 (,) (1.0,2.6) 1.6 (1.0,2.5) 1.5 (0.9,2.5) 0.1 (0.0,0.3) 0.0 (0.0,0.3) (2.3,4.4) 3.1 (2.2,4.3) 2.2 (1.5,3.2) 1.2 (0.7,2.0) 0.1 (0.0,0.7) (4.8,9.2) 6.1 (4.3,8.7) 5.2 (3.5,7.6) 1.4 (0.7,2.9) 0.6 (0.2,1.9) Residence Urban 2.6 (1.9,3.7) 2.6 (1.8,3.7) 2.5 (1.7,3.5) 0.4 (0.2,0.8) 0.1 (0.0,0.3) Rural 2.2 (1.5,3.2) 2.1 (1.4,3.0) 1.5 (1.0,2.2) 0.7 (0.4,1.2) 0.2 (0.0,0.7) EducationLevel 3 PrimarySchoolorLess 4.3 (3.2,5.6) 4.0 (3.0,5.4) 3.0 (2.2,4.1) 1.4 (0.9,2.3) 0.3 (0.1,0.8) AttendedSecondarySchool 2.1 (1.3,3.6) 2.1 (1.2,3.5) 2.0 (1.1,3.4) 0.2 (0.1,0.6) 0.1 (0.0,0.5) HighSchoolGraduate 1.9 (0.7,5.2) 1.8 (0.6,5.2) 1.8 (0.6,5.2) 0.0 (0.0,0.2) 0.1 (0.0,0.5) CollegeGraduateorAbove 0.6 (0.3,1.4) 0.6 (0.3,1.4) 0.6 (0.3,1.4) 0.0 (,) 0.0 (,) Occupation AgricultureWorker 3.0 (2.0,4.4) 2.8 (1.8,4.3) 2.0 (1.3,3.0) 1.0 (0.5,1.7) 0.2 (0.1,0.8) MachineOperator 0.8 (0.3,1.9) 0.8 (0.3,1.9) 0.8 (0.3,1.9) 0.0 (,) 0.0 (,) BusinessorService Employee 1.5 (0.7,3.3) 1.5 (0.7,3.3) 1.5 (0.7,3.3) 0.1 (0.0,0.5) 0.1 (0.0,0.4) Leadersoforganizations 4.1 (0.9,16.6) 4.1 (0.9,16.6) 4.1 (0.9,16.6) 0.0 (,) 0.0 (,) Clerks 0.9 (0.2,4.2) 0.9 (0.2,4.2) 0.9 (0.2,4.2) 0.2 (0.0,1.8) 0.0 (,) SpecializedTechnicians 0.0 (,) 0.0 (,) 0.0 (,) 0.0 (,) 0.0 (,) Medical/HealthPersonnel 0.0 (,) 0.0 (,) 0.0 (,) 0.0 (,) 0.0 (,) TeachingStaff 0.0 (,) 0.0 (,) 0.0 (,) 0.0 (,) 0.0 (,) Soldiers 0.0 (,)* 0.0 (,)* 0.0 (,)* 0.0 (,)* 0.0 (,)* Students 0.9 (0.2,3.9) 0.9 (0.2,3.9) 0.9 (0.2,3.9) 0.0 (,) 0.0 (,) NoJobs 3.1 (1.9,5.1) 3.0 (1.7,5.0) 2.5 (1.4,4.3) 0.8 (0.3,2.0) 0.2 (0.0,0.9) Retired 3.3 (2.0,5.4) 3.2 (1.9,5.3) 3.0 (1.8,4.9) 0.5 (0.2,1.7) 0.1 (0.0,0.6) Others 6.0 (1.9,17.3) 6.0 (1.9,17.3) 6.0 (1.9,17.3) 2.0 (0.2,17.2) 0.0 (,) Region East 1.5 (0.8,2.7) 1.5 (0.8,2.7) 1.4 (0.8,2.6) 0.2 (0.1,0.5) 0.0 (0.0,0.0) Central 4.1 (3.0,5.8) 4.0 (2.9,5.7) 3.0 (2.1,4.3) 1.4 (0.8,2.3) 0.1 (0.0,0.6) West 2.0 (1.3,3.1) 1.8 (1.1,2.9) 1.6 (1.0,2.7) 0.3 (0.1,0.9) 0.2 (0.1,1.1) Note:Currentuseincludesbothdailyandoccasional(lessthandaily)use. 1 Includesmanufacturedandhandrolledcigarettes. 2 Includespipes,cigarsandcigarillos,waterpipes,andothersmokedtobaccoproductsthanmanufacturedandhandrolledcigarettes. 3 Educationlevelisreportedonlyamongrespondents25+yearsold. *Estimatebasedonlessthan25unweightedcases. 125
152 Table4.6:Percentagedistributionofadults15yearsold,bysmokingfrequency,genderand selecteddemographiccharacteristics GATSChina,2010. Demographic Characteristics SmokingFrequency Total Daily Occasional 1 Nonsmoker % N Percentage(95%CI) Overall 24.1 (22.6,25.7) 4.1 (3.5,4.7) 71.9 (70.3,73.3) ,354 Age(years) (11.5,18.0) 3.5 (2.4,5.1) 82.1 (78.4,85.3) 100 1, (23.7,28.0) 5.2 (4.4,6.2) 69.0 (67.0,71.0) 100 5, (28.1,32.5) 3.4 (2.8,4.2) 66.4 (64.2,68.4) 100 5, (17.8,22.7) 2.6 (1.9,3.5) 77.3 (74.7,79.7) 100 2,207 Residence Urban 22.0 (19.8,24.4) 4.1 (3.3,5.0) 73.9 (71.7,76.0) 100 5,832 Rural 25.8 (23.7,28.1) 4.0 (3.3,4.9) 70.2 (67.9,72.3) 100 7,522 EducationLevel 2 PrimarySchoolorLess 21.7 (19.2,24.5) 2.9 (2.2,3.9) 75.4 (72.9,77.8) 100 4,966 AttendedSecondarySchool 31.6 (29.6,33.7) 4.5 (3.6,5.6) 63.9 (61.8,66.0) 100 4,111 HighSchoolGraduate 29.5 (26.1,33.1) 5.4 (4.0,7.4) 65.1 (61.6,68.4) 100 1,887 CollegeGraduateorAbove 21.4 (18.8,24.3) 5.2 (3.5,7.6) 73.4 (69.8,76.7) 100 1,239 Occupation AgricultureWorker 26.9 (24.0,30.0) 3.8 (3.0,4.8) 69.3 (66.2,72.3) 100 5,377 MachineOperator 44.1 (38.9,49.5) 6.9 (4.6,10.1) 49.0 (44.1,53.9) 100 1,253 BusinessorServiceEmployee 24.8 (21.4,28.5) 4.8 (3.5,6.7) 70.3 (66.4,74.0) 100 1,694 Leadersoforganizations 30.4 (25.7,35.6) 5.8 (3.5,9.7) 63.8 (57.5,69.6) Clerks 28.4 (21.8,36.1) 6.8 (3.7,12.4) 64.8 (55.0,73.4) SpecializedTechnicians 30.9 (23.8,39.0) 8.0 (4.5,13.9) 61.1 (52.6,69.0) Medical/HealthPersonnel 15.4 (9.6,23.8) 1.2 (0.3,4.6) 83.3 (75.3,89.2) TeachingStaff 12.4 (7.4,19.9) 2.2 (0.6,8.0) 85.4 (77.0,91.1) Soldiers 46.1 (14.0,81.8)* 1.2 (0.1,9.5)* 52.6 (17.5,85.3)* Students 0.4 (0.1,2.0) 0.8 (0.3,2.0) 98.8 (97.3,99.4) NoJobs 12.4 (9.1,16.6) 2.0 (1.0,4.3) 85.6 (81.1,89.2) 100 1,370 Retired 16.0 (13.1,19.5) 2.4 (1.6,3.7) 81.5 (77.9,84.7) 100 1,451 Others 29.3 (17.5,44.6) 9.4 (3.9,21.0) 61.4 (48.1,73.1) Region East 22.3 (19.6,25.1) 3.9 (3.0,5.2) 73.8 (71.5,75.9) 100 4,402 Central 23.8 (21.7,26.1) 4.4 (3.5,5.4) 71.9 (69.6,74.0) 100 3,940 West 26.4 (23.5,29.6) 3.9 (3.2,4.8) 69.6 (66.2,72.9) 100 5,012 1 Occasionalreferstolessthandailyuse. 2 Educationlevelisreportedonlyamongrespondents25+yearsold. *Estimatebasedonlessthan25unweightedcases. 126
153 Table4.6(cont.):Percentagedistributionofadults15yearsold,bysmokingfrequency,genderand selecteddemographiccharacteristics GATSChina,2010. Demographic Characteristics SmokingFrequency Total Daily Occasional 1 Nonsmoker % N Percentage(95%CI) Male 45.4 (42.8,48.0) 7.6 (6.6,8.7) 47.1 (44.8,49.4) 100 6,603 Age(years) (22.0,33.6) 6.1 (4.2,8.9) 66.4 (60.4,72.0) (45.3,53.1) 10.1 (8.5,11.9) 40.7 (37.2,44.4) 100 2, (53.5,59.9) 6.2 (5.0,7.7) 37.0 (34.2,40.0) 100 2, (31.4,40.2) 4.6 (3.3,6.3) 59.8 (55.1,64.2) 100 1,118 Residence Urban 41.7 (38.4,45.1) 7.5 (6.0,9.3) 50.8 (47.8,53.9) 100 2,787 Rural 48.4 (44.5,52.4) 7.6 (6.3,9.2) 43.9 (40.4,47.5) 100 3,816 EducationLevel 2 PrimarySchoolorLess 51.8 (47.0,56.7) 7.0 (5.1,9.6) 41.1 (37.1,45.3) 100 2,016 AttendedSecondarySchool 55.4 (51.9,58.9) 7.8 (6.3,9.7) 36.8 (33.8,39.9) 100 2,258 HighSchoolGraduate 49.2 (44.4,54.1) 9.0 (6.5,12.2) 41.8 (37.3,46.4) 100 1,084 CollegeGraduateorAbove 35.5 (31.5,39.8) 8.4 (5.6,12.5) 56.0 (50.5,61.4) Occupation AgricultureWorker 52.9 (47.8,58.0) 7.4 (5.8,9.5) 39.6 (34.6,44.9) 100 2,559 MachineOperator 57.9 (52.0,63.7) 9.0 (6.1,13.2) 33.0 (28.4,38.1) BusinessorServiceEmployee 49.7 (44.0,55.4) 9.4 (6.8,13.0) 40.9 (35.7,46.3) Leadersoforganizations 45.3 (38.9,51.8) 8.8 (5.0,14.9) 45.9 (37.0,55.0) Clerks 45.0 (34.2,56.4) 10.5 (5.4,19.3) 44.5 (30.5,59.3) SpecializedTechnicians 41.6 (32.5,51.2) 10.8 (6.1,18.5) 47.7 (38.0,57.5) Medical/HealthPersonnel 37.5 (24.1,53.1) 3.0 (0.7,11.1) 59.6 (44.6,73.0) TeachingStaff 30.9 (18.7,46.6) 5.6 (1.4,19.1) 63.5 (46.2,77.9) Soldiers 46.2 (14.0,81.9)* 1.2 (0.1,9.5)* 52.5 (17.5,85.3)* Students 0.8 (0.2,3.4) 0.7 (0.2,2.7) 98.5 (96.0,99.5) NoJobs 41.8 (33.6,50.5) 7.8 (3.6,15.8) 50.4 (43.5,57.4) Retired 33.5 (27.6,40.0) 4.5 (2.8,7.1) 62.0 (55.5,68.1) Others 42.7 (22.7,65.3) 13.1 (6.0,26.5) 44.2 (29.4,60.2) Region East 41.5 (36.6,46.5) 7.3 (5.5,9.6) 51.3 (47.6,55.0) 100 2,176 Central 43.3 (40.1,46.6) 8.1 (6.5,10.2) 48.6 (45.3,51.9) 100 1,964 West 51.8 (47.2,56.3) 7.5 (6.1,9.1) 40.8 (36.0,45.7) 100 2,463 1 Occasionalreferstolessthandailyuse. 2 Educationlevelisreportedonlyamongrespondents25+yearsold. *Estimatebasedonlessthan25unweightedcases. 127
154 Table4.6(cont.):Percentagedistributionofadults15yearsold,bysmokingfrequency,genderand selecteddemographiccharacteristics GATSChina,2010. Demographic Characteristics SmokingFrequency Total Daily Occasional 1 Nonsmoker % N Percentage(95%CI) Female 2.0 (1.5,2.6) 0.4 (0.2,0.7) 97.6 (96.9,98.1) 100 6,751 Age(years) (0.0,0.6) 0.5 (0.1,2.0) 99.3 (98.1,99.8) (0.8,2.5) 0.2 (0.1,0.4) 98.4 (97.4,99.0) 100 2, (1.9,3.7) 0.5 (0.3,1.0) 96.8 (95.6,97.7) 100 2, (4.2,8.4) 0.7 (0.3,1.6) 93.3 (90.8,95.2) 100 1,089 Residence Urban 2.0 (1.4,2.9) 0.6 (0.3,1.3) 97.4 (96.3,98.1) 100 3,045 Rural 2.0 (1.3,3.0) 0.2 (0.1,0.5) 97.8 (96.8,98.5) 100 3,706 EducationLevel 2 PrimarySchoolorLess 3.8 (2.8,5.2) 0.4 (0.3,0.7) 95.7 (94.4,96.8) 100 2,950 AttendedSecondarySchool 1.8 (1.1,3.1) 0.3 (0.1,0.8) 97.9 (96.4,98.7) 100 1,853 HighSchoolGraduate 1.5 (0.4,5.0) 0.4 (0.1,2.4) 98.1 (94.8,99.3) CollegeGraduateorAbove 0.3 (0.1,1.1) 0.3 (0.1,0.9) 99.4 (98.6,99.7) Occupation AgricultureWorker 2.6 (1.7,4.1) 0.3 (0.1,0.7) 97.0 (95.6,98.0) 100 2,818 MachineOperator 0.5 (0.2,1.5) 0.3 (0.1,1.1) 99.2 (98.1,99.7) BusinessorServiceEmployee 1.1 (0.4,2.9) 0.5 (0.1,1.6) 98.5 (96.7,99.3) Leadersoforganizations 3.6 (0.7,17.5) 0.5 (0.1,2.3) 95.9 (83.4,99.1) Clerks 0.2 (0.0,1.8) 0.7 (0.1,4.9) 99.1 (95.8,99.8) SpecializedTechnicians 0.0 (,) 0.0 (,) (,) Medical/HealthPersonnel 0.0 (,) 0.0 (,) (,) TeachingStaff 0.0 (,) 0.0 (,) (,) Soldiers 0.0 (,)* 0.0 (,)* (,)* Students 0.0 (,) 0.9 (0.2,3.9) 99.1 (96.1,99.8) NoJobs 2.9 (1.8,4.7) 0.2 (0.1,0.7) 96.9 (94.9,98.1) 100 1,052 Retired 2.4 (1.5,4.0) 0.8 (0.4,1.7) 96.7 (94.6,98.0) Others 3.8 (1.0,13.8) 2.2 (0.6,8.3) 94.0 (82.7,98.1) Region East 1.2 (0.6,2.5) 0.3 (0.1,0.6) 98.5 (97.3,99.2) 100 2,226 Central 3.7 (2.6,5.2) 0.5 (0.2,1.1) 95.9 (94.2,97.0) 100 1,976 West 1.5 (1.0,2.4) 0.5 (0.2,1.4) 98.0 (96.9,98.7) 100 2,549 1 Occasionalreferstolessthandailyuse. 2 Educationlevelisreportedonlyamongrespondents25+yearsold. *Estimatebasedonlessthan25unweightedcases. 128
155 Table4.7:Percentageandnumberofadults15to69yearsold,bydetailedsmokingstatusandgender GATSChina,2010. SmokingStatus Overall Male Female Percentage(95%CI) WeightedNumber inthousands Percentage(95%CI) WeightedNumber inthousands Percentage(95%CI) WeightedNumber inthousands Evertobaccosmoker 33.3 (31.4,35.3) 333, (60.2,65.1) 320, (2.0,3.3) 12,416 Currenttobaccosmoker 28.7 (27.1,30.3) 284, (51.6,56.3) 274, (1.6,2.8) 10,171 Dailysmoker 24.5 (22.9,26.2) 243, (43.6,48.8) 234, (1.3,2.3) 8,358 Occasionalsmoker 4.2 (3.6,4.8) 41, (6.7,9.0) 39, (0.2,0.7) 1,813 Occasionalsmoker,formerlydaily 1.3 (1.0,1.6) 12, (1.8,3.0) 11, (0.0,0.2) 446 Occasionalsmoker,neverdaily 2.9 (2.4,3.5) 28, (4.5,6.5) 27, (0.1,0.6) 1,367 Nonsmoker 71.3 (69.7,72.9) 708, (43.7,48.4) 233, (97.2,98.4) 474,310 Note:Currentuseincludesbothdailyandoccasional(lessthandaily)use. *Estimatebasedonlessthan25unweightedcases. 129
156 Table4.8:Numberofadults>=15yearsoldwhoarecurrentsmokersofvarioussmokedtobacco products,bygenderandselecteddemographiccharacteristics GATSChina,2010. DemographicCharacteristics AnySmoked TobaccoProduct AnyCigarette 1 Manufactured TypeofCigarette WeightedNumberinThousands Handrolled OtherSmoked Tobacco 2 Overall 300, , ,932 24,358 9,212 Age(years) ,121 40,959 40, , , ,254 4,010 1, , ,446 95,988 13,887 3, ,822 22,364 18,731 5,879 2,727 Residence Urban 128, , ,614 3,922 1,772 Rural 172, , ,318 20,436 7,440 EducationLevel 3 PrimarySchoolorLess 68,678 65,522 57,385 14,800 5,453 AttendedSecondarySchool 110, , ,370 7,752 1,529 HighSchoolGraduate 54,930 54,527 54,378 1,092 1,128 CollegeGraduateorAbove 25,840 25,840 25, Occupation AgricultureWorker 103, ,182 92,177 16,748 5,269 MachineOperator 59,052 58,687 58,202 1, BusinessorServiceEmployee 49,606 49,403 48,812 1, LeadersofOrganizations 20,158 19,946 19, Clerks 6,563 6,563 6, SpecializedTechnicians 16,544 16,544 16, Medical/HealthPersonnel 2,975 2,813 2, TeachingStaff 2,424 2,400 2, Soldiers Students NoJobs 16,914 16,703 15,722 2, Retired 19,024 18,778 17,990 1,497 1,389 Others 2,208 2,208 2, Region East 108, , ,463 9, Central 82,150 81,551 77,992 7,235 1,634 West 109, , ,477 7,176 6,763 Note:Currentuseincludesbothdailyandoccasional(lessthandaily)use. 1 Includesmanufacturedandhandrolledcigarettes. 2 Includespipes,cigarsandcigarillos,waterpipes,andothersmokedtobaccoproductsthanmanufacturedandhandrolledcigarettes. 3 Educationlevelisreportedonlyamongrespondents25+yearsold. *Estimatebasedonlessthan25unweightedcases. 130
157 Table4.8(cont.):Numberofadults>=15yearswhoarecurrentsmokersofvarioussmokedtobacco products,bygenderandselecteddemographiccharacteristics GATSChina,2010. DemographicCharacteristics AnySmoked TobaccoProduct AnyCigarette 1 Manufactured TypeofCigarette WeightedNumberinThousands Handrolled OtherSmoked Tobacco 2 Male 288, , ,790 21,498 8,604 Age(years) ,376 40,213 40, , , ,087 3,813 1, ,127 97,731 92,621 12,075 3, ,161 19,001 15,869 5,097 2,373 Residence Urban 122, , ,597 3,061 1,626 Rural 165, , ,193 18,437 6,978 EducationLevel 3 PrimarySchoolorLess 61,194 58,447 52,062 12,314 4,987 AttendedSecondarySchool 107, , ,723 7,460 1,431 HighSchoolGraduate 53,696 53,337 53,188 1,078 1,083 CollegeGraduateorAbove 25,603 25,603 25, Occupation AgricultureWorker 98,497 95,352 88,734 15,064 4,896 MachineOperator 58,843 58,478 57,992 1, BusinessorServiceEmployee 48,280 48,122 47,531 1, LeadersofOrganizations 19,342 19,130 19, Clerks 6,501 6,501 6, SpecializedTechnicians 16,544 16,544 16, Medical/HealthPersonnel 2,975 2,813 2, TeachingStaff 2,424 2,400 2, Soldiers Students NoJobs 14,162 14,076 13,496 1, Retired 17,138 16,936 16,270 1,192 1,345 Others 2,089 2,089 2, Region East 105, , ,649 9, Central 76,191 75,734 73,629 5,284 1,470 West 106, ,727 99,512 6,718 6,324 Note:Currentuseincludesbothdailyandoccasional(lessthandaily)use. 1 Includesmanufacturedandhandrolledcigarettes. 2 Includespipes,cigarsandcigarillos,waterpipes,andothersmokedtobaccoproductsthanmanufacturedandhandrolledcigarettes. 3 Educationlevelisreportedonlyamongrespondents25+yearsold. *Estimatebasedonlessthan25unweightedcases. 131
158 Table4.8(cont.):Numberofadults>=15yearsoldwhoarecurrentsmokersofvarioussmokedtobacco products,bygenderandselecteddemographiccharacteristics GATSChina,2010. DemographicCharacteristics AnySmoked TobaccoProduct AnyCigarette 1 Manufactured TypeofCigarette WeightedNumberinThousands Handrolled OtherSmoked Tobacco 2 Female 12,603 12,052 10,142 2, Age(years) ,326 3,228 3, ,870 4,715 3,367 1, ,661 3,363 2, Residence Urban 6,408 6,281 6, Rural 6,195 5,770 4,125 1, EducationLevel 3 PrimarySchoolorLess 7,484 7,075 5,323 2, AttendedSecondarySchool 2,902 2,804 2, HighSchoolGraduate 1,234 1,190 1, CollegeGraduateorAbove Occupation AgricultureWorker 5,166 4,831 3,444 1, MachineOperator BusinessorServiceEmployee 1,326 1,281 1, LeadersofOrganizations Clerks SpecializedTechnicians Medical/HealthPersonnel TeachingStaff Soldiers Students NoJobs 2,753 2,626 2, Retired 1,887 1,842 1, Others Region East 2,964 2,958 2, Central 5,959 5,816 4,362 1, West 3,679 3,277 2, Note:Currentuseincludesbothdailyandoccasional(lessthandaily)use. 1 Includesmanufacturedandhandrolledcigarettes. 2 Includespipes,cigarsandcigarillos,waterpipes,andothersmokedtobaccoproductsthanmanufacturedandhandrolledcigarettes. 3 Educationlevelisreportedonlyamongrespondents25+yearsold. *Estimatebasedonlessthan25unweightedcases. 132
159 Table4.9:Numberofadults15to69yearsoldwhoarecurrentsmokersofvarioussmokedtobacco products,bygenderandselecteddemographiccharacteristics GATSChina,2010. DemographicCharacteristics AnySmoked TobaccoProduct AnyCigarette 1 Manufactured NumberinThousands TypeofCigarette Handrolled OtherSmoked Tobacco 2 Overall 284, , ,431 20,033 6,931 Age(years) ,121 40,959 40, , , ,254 4,010 1, , ,446 95,988 13,887 3, ,558 7,307 6,231 1, Residence Urban 123, , ,052 3,475 1,535 Rural 160, , ,379 16,558 5,396 EducationLevel 3 PrimarySchoolorLess 55,206 53,223 47,579 10,591 3,217 AttendedSecondarySchool 108, , ,173 7,636 1,496 HighSchoolGraduate 53,843 53,440 53,291 1,092 1,116 CollegeGraduateorAbove 25,429 25,429 25, Occupation AgricultureWorker 95,967 93,410 87,170 13,778 4,006 MachineOperator 58,969 58,637 58,156 1, BusinessorServiceEmployee 49,312 49,109 48,518 1, LeadersofOrganizations 20,147 19,935 19, Clerks 6,563 6,563 6, SpecializedTechnicians 16,322 16,322 16, Medical/HealthPersonnel 2,938 2,776 2, TeachingStaff 2,385 2,361 2, Soldiers Students NoJobs 15,213 15,128 14,430 1, Retired 13,128 13,005 12, Others 1,922 1,922 1, Region East 105, , ,293 8, Central 77,361 77,050 73,987 6,435 1,252 West 101,999 99,189 97,151 4,758 4,882 Note:Currentuseincludesbothdailyandoccasional(lessthandaily)use. 1 Includesmanufacturedandhandrolledcigarettes. 2 Includespipes,cigarsandcigarillos,waterpipes,andothersmokedtobaccoproductsthanmanufacturedandhandrolledcigarettes. 3 Educationlevelisreportedonlyamongrespondents25+yearsold. *Estimatebasedonlessthan25unweightedcases. 133
160 Table4.9(cont.):Numberofadults15to69yearsoldwhoarecurrentsmokersofvarioussmoked tobaccoproducts,bygenderandselecteddemographiccharacteristics GATSChina,2010. DemographicCharacteristics AnySmoked TobaccoProduct AnyCigarette 1 Manufactured NumberinThousands TypeofCigarette Handrolled OtherSmoked Tobacco 2 Male 274, , ,121 17,757 6,677 Age(years) ,376 40,213 40, , , ,087 3,813 1, ,127 97,731 92,621 12,075 3, ,329 6,079 5,200 1, Residence Urban 118, , ,096 2,922 1,535 Rural 155, , ,025 14,835 5,142 EducationLevel 3 PrimarySchoolorLess 50,102 48,231 44,037 8,689 3,106 AttendedSecondarySchool 105, , ,577 7,344 1,398 HighSchoolGraduate 52,609 52,250 52,101 1,078 1,071 CollegeGraduateorAbove 25,192 25,192 25, Occupation AgricultureWorker 91,676 89,284 84,252 12,317 3,841 MachineOperator 58,759 58,427 57,947 1, BusinessorServiceEmployee 48,025 47,866 47,275 1, LeadersofOrganizations 19,331 19,119 19, Clerks 6,501 6,501 6, SpecializedTechnicians 16,322 16,322 16, Medical/HealthPersonnel 2,938 2,776 2, TeachingStaff 2,385 2,361 2, Soldiers Students NoJobs 13,325 13,240 12, Retired 11,837 11,759 11, Others 1,862 1,862 1, Region East 102, ,011 98,890 8, Central 72,294 71,983 70,253 4,648 1,252 West 99,387 96,830 94,978 4,507 4,628 Note:Currentuseincludesbothdailyandoccasional(lessthandaily)use. 1 Includesmanufacturedandhandrolledcigarettes. 2 Includespipes,cigarsandcigarillos,waterpipes,andothersmokedtobaccoproductsthanmanufacturedandhandrolledcigarettes. 3 Educationlevelisreportedonlyamongrespondents25+yearsold. *Estimatebasedonlessthan25unweightedcases. 134
161 Table4.9(cont.):Numberofadults15to69yearsoldwhoarecurrentsmokersofvarioussmoked tobaccoproducts,bygenderandselecteddemographiccharacteristics GATSChina,2010. DemographicCharacteristics AnySmoked TobaccoProduct AnyCigarette 1 Manufactured NumberinThousands TypeofCigarette Handrolled OtherSmoked Tobacco 2 Female 10,171 9,917 8,310 2, Age(years) ,326 3,228 3, ,870 4,715 3,367 1, ,229 1,229 1, Residence Urban 5,149 5,149 4, Rural 5,022 4,768 3,354 1, EducationLevel 3 PrimarySchoolorLess 5,103 4,992 3,543 1, AttendedSecondarySchool 2,851 2,753 2, HighSchoolGraduate 1,234 1,190 1, CollegeGraduateorAbove Occupation AgricultureWorker 4,291 4,126 2,918 1, MachineOperator BusinessorServiceEmployee 1,287 1,243 1, LeadersofOrganizations Clerks SpecializedTechnicians Medical/HealthPersonnel TeachingStaff Soldiers Students NoJobs 1,888 1,888 1, Retired 1,291 1,246 1, Others Region East 2,491 2,491 2, Central 5,068 5,068 3,734 1,786 0 West 2,612 2,358 2, Note:Currentuseincludesbothdailyandoccasional(lessthandaily)use. 1 Includesmanufacturedandhandrolledcigarettes. 2 Includespipes,cigarsandcigarillos,waterpipes,andothersmokedtobaccoproductsthanmanufacturedandhandrolledcigarettes. 3 Educationlevelisreportedonlyamongrespondents25+yearsold. *Estimatebasedonlessthan25unweightedcases. 135
162 Table4.10:Percentageofadults15to69yearsoldwhoarecurrentsmokersofvarioussmokedtobacco products,bygenderandselecteddemographiccharacteristics(1) GATSChina,2010. DemographicCharacteristics AnySmoked TobaccoProduct AnyCigarette 1 Manufactured Percentage(95%CI) TypeofCigarette Handrolled OtherSmoked Tobacco 2 Overall 28.7 (27.1,30.3) 28.3 (26.7,29.9) 27.4 (25.9,29.0) 2.0 (1.4,3.0) 0.7 (0.4,1.1) Age(years) (14.7,21.6) 17.8 (14.6,21.6) 17.8 (14.6,21.6) 0.3 (0.1,0.9) 0.4 (0.1,1.1) (29.0,33.0) 30.8 (28.8,32.8) 30.6 (28.7,32.7) 1.0 (0.6,1.5) 0.4 (0.2,0.9) (31.6,35.8) 32.8 (30.7,35.0) 30.8 (28.7,32.9) 4.4 (2.9,6.8) 1.2 (0.7,2.1) (21.7,31.0) 25.2 (20.8,30.1) 21.5 (17.7,25.9) 5.4 (3.3,8.5) 1.5 (0.7,3.5) Residence Urban 27.1 (24.8,29.4) 27.0 (24.7,29.3) 26.7 (24.5,29.1) 0.8 (0.5,1.3) 0.3 (0.2,0.6) Rural 30.0 (27.7,32.4) 29.4 (27.1,31.9) 28.1 (25.9,30.4) 3.1 (2.0,4.7) 1.0 (0.6,1.8) EducationLevel 3 PrimarySchoolorLess 24.9 (22.0,28.1) 24.0 (21.2,27.1) 21.5 (18.8,24.4) 4.8 (3.4,6.6) 1.5 (0.8,2.8) AttendedSecondarySchool 36.8 (34.7,39.0) 36.4 (34.4,38.5) 35.6 (33.5,37.7) 2.6 (1.6,4.2) 0.5 (0.3,1.0) HighSchoolGraduate 35.5 (32.0,39.2) 35.3 (31.7,39.0) 35.2 (31.6,38.9) 0.7 (0.4,1.3) 0.7 (0.3,1.9) CollegeGraduateorAbove 27.0 (23.6,30.7) 27.0 (23.6,30.7) 27.0 (23.6,30.7) 0.1 (0.0,0.7) 0.3 (0.1,0.8) Occupation AgricultureWorker 30.9 (27.8,34.2) 30.1 (26.9,33.5) 28.1 (24.9,31.4) 4.4 (3.0,6.4) 1.3 (0.7,2.5) MachineOperator 51.0 (46.1,56.0) 50.8 (45.9,55.6) 50.3 (45.5,55.1) 1.1 (0.6,2.1) 0.6 (0.3,1.2) BusinessorService Employee 29.6 (25.9,33.6) 29.5 (25.8,33.5) 29.1 (25.4,33.2) 1.0 (0.5,1.8) 0.5 (0.2,1.0) Leadersoforganizations 36.3 (30.4,42.6) 35.9 (30.1,42.2) 35.9 (30.1,42.2) 0.2 (0.1,0.5) 0.6 (0.1,2.7) Clerks 35.2 (26.6,45.0) 35.2 (26.6,45.0) 35.2 (26.6,45.0) 0.9 (0.3,2.2) 0.0 (,) SpecializedTechnicians 38.6 (30.7,47.1) 38.6 (30.7,47.1) 38.6 (30.7,47.1) 0.8 (0.3,2.3) 0.1 (0.0,0.6) Medical/HealthPersonnel 16.5 (10.7,24.7) 15.6 (10.0,23.7) 15.6 (10.0,23.7) 2.6 (0.4,16.2) 0.0 (,) TeachingStaff 14.5 (8.9,22.9) 14.4 (8.7,22.8) 14.4 (8.7,22.8) 0.0 (,) 0.1 (0.0,1.0) Soldiers 47.4 (14.7,82.5)* 47.4 (14.7,82.5)* 47.4 (14.7,82.5)* 0.0 (,)* 20.2 (2.8,69.0)* Students 1.2 (0.6,2.7) 1.2 (0.6,2.7) 1.2 (0.6,2.7) 0.0 (,) 0.0 (,) NoJobs 14.5 (10.6,19.5) 14.4 (10.5,19.4) 13.7 (10.1,18.4) 1.5 (0.8,2.7) 0.2 (0.1,0.8) Retired 18.9 (15.0,23.6) 18.7 (14.8,23.4) 18.3 (14.4,22.9) 1.0 (0.5,2.2) 0.9 (0.2,3.9) Others 42.9 (32.2,54.3) 42.9 (32.2,54.3) 42.9 (32.2,54.3) 0.9 (0.2,4.1) 0.0 (,) Region East 27.1 (24.9,29.4) 26.9 (24.8,29.2) 26.1 (24.1,28.2) 2.3 (1.1,4.8) 0.2 (0.1,0.5) Central 28.5 (26.3,30.9) 28.4 (26.2,30.8) 27.3 (24.9,29.7) 2.4 (1.5,3.7) 0.5 (0.2,1.0) West 30.6 (27.0,34.4) 29.7 (26.1,33.6) 29.1 (25.6,32.9) 1.4 (0.8,2.4) 1.5 (0.8,2.7) Note:Currentuseincludesbothdailyandoccasional(lessthandaily)use. 1 Includesmanufacturedandhandrolledcigarettes. 2 Includespipes,cigarsandcigarillos,waterpipes,andothersmokedtobaccoproductsthanmanufacturedandhandrolledcigarettes. 3 Educationlevelisreportedonlyamongrespondents25+yearsold. *Estimatebasedonlessthan25unweightedcases. 136
163 Table4.10(cont.):Percentageofadults15to69yearsoldwhoarecurrentsmokersofvarioussmoked tobaccoproducts,bygenderandselecteddemographiccharacteristics(1) GATSChina,2010. DemographicCharacteristics AnySmoked TobaccoProduct AnyCigarette 1 Manufactured Percentage(95%CI) TypeofCigarette Handrolled OtherSmoked Tobacco 2 Male 54.0 (51.6,56.3) 53.3 (50.9,55.7) 52.0 (49.6,54.3) 3.5 (2.3,5.3) 1.3 (0.8,2.1) Age(years) (28.0,39.6) 33.5 (27.8,39.6) 33.5 (27.8,39.6) 0.4 (0.1,1.8) 0.7 (0.2,2.0) (55.6,62.8) 59.0 (55.3,62.5) 58.6 (55.0,62.2) 1.8 (1.1,2.8) 0.8 (0.4,1.6) (60.0,65.8) 61.4 (58.4,64.4) 58.2 (54.9,61.5) 7.6 (4.7,12.0) 2.3 (1.3,3.8) (38.4,53.3) 43.9 (36.6,51.5) 37.6 (30.8,44.8) 9.8 (6.3,14.8) 3.2 (1.4,7.2) Residence Urban 51.0 (47.9,54.1) 50.8 (47.7,53.8) 50.4 (47.2,53.5) 1.3 (0.8,2.1) 0.7 (0.4,1.2) Rural 56.5 (52.8,60.1) 55.4 (51.7,59.1) 53.3 (49.7,56.9) 5.4 (3.4,8.4) 1.9 (1.1,3.2) EducationLevel 3 PrimarySchoolorLess 62.8 (57.4,67.8) 60.5 (55.3,65.4) 55.2 (50.1,60.2) 10.9 (7.6,15.4) 3.9 (2.1,7.2) AttendedSecondarySchool 64.7 (61.6,67.7) 64.1 (61.0,67.0) 62.6 (59.3,65.8) 4.5 (2.7,7.3) 0.9 (0.4,1.6) HighSchoolGraduate 59.5 (54.6,64.3) 59.1 (54.0,64.1) 58.9 (53.8,63.9) 1.2 (0.7,2.2) 1.2 (0.4,3.4) CollegeGraduateorAbove 45.2 (39.7,50.8) 45.2 (39.7,50.8) 45.2 (39.7,50.8) 0.2 (0.0,1.2) 0.5 (0.1,1.5) Occupation AgricultureWorker 61.2 (55.8,66.4) 59.6 (54.3,64.7) 56.3 (50.7,61.6) 8.2 (5.5,12.1) 2.6 (1.3,5.0) MachineOperator 67.0 (62.0,71.7) 66.6 (61.7,71.2) 66.1 (61.2,70.6) 1.5 (0.8,2.7) 0.8 (0.4,1.6) BusinessorService Employee 59.1 (53.7,64.3) 58.9 (53.5,64.1) 58.2 (52.7,63.5) 1.9 (1.0,3.4) 0.9 (0.4,2.0) Leadersoforganizations 54.2 (45.0,63.2) 53.6 (44.5,62.5) 53.6 (44.5,62.5) 0.3 (0.1,0.8) 1.0 (0.2,4.2) Clerks 55.5 (40.7,69.5) 55.5 (40.7,69.5) 55.5 (40.7,69.5) 1.2 (0.4,3.4) 0.0 (,) SpecializedTechnicians 52.0 (42.2,61.7) 52.0 (42.2,61.7) 52.0 (42.2,61.7) 1.0 (0.4,3.0) 0.2 (0.0,0.8) Medical/HealthPersonnel 40.5 (26.8,55.8) 38.3 (25.0,53.6) 38.3 (25.0,53.6) 6.5 (1.0,33.2) 0.0 (,) TeachingStaff 36.9 (22.3,54.5) 36.6 (21.9,54.2) 36.6 (21.9,54.2) 0.0 (,) 0.4 (0.0,2.7) Soldiers 47.5 (14.7,82.5)* 47.5 (14.7,82.5)* 47.5 (14.7,82.5)* 0.0 (,)* 20.2 (2.8,69.1)* Students 1.5 (0.5,4.0) 1.5 (0.5,4.0) 1.5 (0.5,4.0) 0.0 (,) 0.0 (,) NoJobs 50.9 (43.0,58.7) 50.6 (42.7,58.4) 49.1 (41.7,56.5) 3.6 (2.0,6.6) 0.8 (0.2,3.0) Retired 44.4 (36.6,52.6) 44.1 (36.3,52.2) 43.4 (35.6,51.5) 2.2 (1.0,4.8) 2.1 (0.4,10.0) Others 63.0 (48.2,75.7) 63.0 (48.2,75.7) 63.0 (48.2,75.7) 1.4 (0.3,5.9) 0.0 (,) Region East 50.1 (46.4,53.8) 49.8 (46.1,53.6) 48.3 (44.8,51.9) 4.2 (1.9,8.8) 0.4 (0.2,1.0) Central 52.4 (48.9,55.8) 52.2 (48.7,55.6) 50.9 (47.2,54.6) 3.4 (2.1,5.4) 0.9 (0.4,1.9) West 60.1 (55.0,64.9) 58.5 (53.4,63.5) 57.4 (52.4,62.3) 2.7 (1.7,4.4) 2.8 (1.5,5.1) Note:Currentuseincludesbothdailyandoccasional(lessthandaily)use. 1 Includesmanufacturedandhandrolledcigarettes. 2 Includespipes,cigarsandcigarillos,waterpipes,andothersmokedtobaccoproductsthanmanufacturedandhandrolledcigarettes. 3 Educationlevelisreportedonlyamongrespondents25+yearsold. *Estimatebasedonlessthan25unweightedcases. 137
164 Table4.10(cont.):Percentageofadults15to69yearsoldwhoarecurrentsmokersofvarioussmoked tobaccoproducts,bygenderandselecteddemographiccharacteristics(1) GATSChina,2010. DemographicCharacteristics AnySmoked TobaccoProduct AnyCigarette 1 Manufactured Percentage(95%CI) TypeofCigarette Handrolled OtherSmoked Tobacco 2 Female 2.1 (1.6,2.8) 2.0 (1.5,2.7) 1.7 (1.3,2.3) 0.5 (0.3,0.7) 0.1 (0.0,0.4) Age(years) (0.2,1.9) 0.7 (0.2,1.9) 0.7 (0.2,1.9) 0.1 (0.0,0.5) 0.0 (,) (1.0,2.6) 1.6 (1.0,2.5) 1.5 (0.9,2.5) 0.1 (0.0,0.3) 0.0 (0.0,0.3) (2.3,4.4) 3.1 (2.2,4.3) 2.2 (1.5,3.2) 1.2 (0.7,2.0) 0.1 (0.0,0.7) (4.5,14.2) 8.1 (4.5,14.2) 6.8 (3.4,13.2) 1.3 (0.4,4.0) 0.0 (,) Residence Urban 2.3 (1.5,3.4) 2.3 (1.5,3.4) 2.2 (1.5,3.3) 0.2 (0.1,0.7) 0.0 (,) Rural 1.9 (1.3,2.8) 1.8 (1.3,2.6) 1.3 (0.9,1.9) 0.7 (0.4,1.1) 0.1 (0.0,0.7) EducationLevel 3 PrimarySchoolorLess 3.6 (2.6,4.9) 3.5 (2.6,4.8) 2.5 (1.7,3.6) 1.3 (0.8,2.3) 0.1 (0.0,0.6) AttendedSecondarySchool 2.2 (1.3,3.6) 2.1 (1.2,3.5) 2.0 (1.1,3.4) 0.2 (0.1,0.6) 0.1 (0.0,0.5) HighSchoolGraduate 2.0 (0.7,5.4) 1.9 (0.6,5.4) 1.9 (0.6,5.4) 0.0 (0.0,0.2) 0.1 (0.0,0.5) CollegeGraduateorAbove 0.6 (0.3,1.5) 0.6 (0.3,1.5) 0.6 (0.3,1.5) 0.0 (,) 0.0 (,) Occupation AgricultureWorker 2.7 (1.8,4.0) 2.6 (1.7,3.9) 1.8 (1.2,2.8) 0.9 (0.5,1.6) 0.1 (0.0,0.7) MachineOperator 0.8 (0.3,1.9) 0.8 (0.3,1.9) 0.8 (0.3,1.9) 0.0 (,) 0.0 (,) BusinessorService Employee 1.5 (0.7,3.3) 1.5 (0.6,3.3) 1.5 (0.6,3.3) 0.1 (0.0,0.5) 0.1 (0.0,0.4) Leadersoforganizations 4.1 (0.9,16.6) 4.1 (0.9,16.6) 4.1 (0.9,16.6) 0.0 (,) 0.0 (,) Clerks 0.9 (0.2,4.2) 0.9 (0.2,4.2) 0.9 (0.2,4.2) 0.2 (0.0,1.8) 0.0 (,) SpecializedTechnicians 0.0 (,) 0.0 (,) 0.0 (,) 0.0 (,) 0.0 (,) Medical/HealthPersonnel 0.0 (,) 0.0 (,) 0.0 (,) 0.0 (,) 0.0 (,) TeachingStaff 0.0 (,) 0.0 (,) 0.0 (,) 0.0 (,) 0.0 (,) Soldiers 0.0 (,)* 0.0 (,)* 0.0 (,)* 0.0 (,)* 0.0 (,)* Students 0.9 (0.2,3.9) 0.9 (0.2,3.9) 0.9 (0.2,3.9) 0.0 (,) 0.0 (,) NoJobs 2.4 (1.2,4.6) 2.4 (1.2,4.6) 2.0 (1.0,4.0) 0.8 (0.3,2.2) 0.0 (,) Retired 3.0 (1.6,5.7) 2.9 (1.5,5.6) 2.7 (1.4,5.1) 0.3 (0.1,1.4) 0.1 (0.0,0.8) Others 4.0 (1.0,14.2)* 4.0 (1.0,14.2)* 4.0 (1.0,14.2)* 0.0 (,)* 0.0 (,)* Region East 1.4 (0.7,2.6) 1.4 (0.7,2.6) 1.3 (0.7,2.6) 0.1 (0.1,0.3) 0.0 (,) Central 3.8 (2.7,5.4) 3.8 (2.7,5.4) 2.8 (1.9,4.2) 1.3 (0.8,2.3) 0.0 (,) West 1.6 (1.0,2.5) 1.4 (0.8,2.3) 1.3 (0.8,2.2) 0.1 (0.0,0.5) 0.2 (0.0,1.0) Note:Currentuseincludesbothdailyandoccasional(lessthandaily)use. 1 Includesmanufacturedandhandrolledcigarettes. 2 Includespipes,cigarsandcigarillos,waterpipes,andothersmokedtobaccoproductsthanmanufacturedandhandrolledcigarettes. 3 Educationlevelisreportedonlyamongrespondents25+yearsold. *Estimatebasedonlessthan25unweightedcases. 138
165 Table4.11:Percentageofadults15to69yearsoldwhoarecurrentsmokersofvarioussmokedtobacco products,bygenderandselecteddemographiccharacteristics(2) GATSChina,2010. DemographicCharacteristics AnySmokedTobacco Product AnyCigarette 1 Manufactured Percentage(95%CI) TypeofCigarette Handrolled OtherSmoked Tobacco 2 Overall 28.7 (27.1,30.3) 28.3 (26.7,29.9) 27.4 (25.9,29.0) 2.0 (1.4,3.0) 0.7 (0.4,1.1) Age(years) (5.0,14.5) 8.6 (5.0,14.5) 8.6 (5.0,14.5) 0.0 (,) 0.0 (0.0,0.0) (19.5,29.3) 23.9 (19.3,29.3) 23.9 (19.3,29.3) 0.4 (0.1,1.5) 0.6 (0.2,1.8) (24.0,33.4) 28.4 (24.0,33.3) 28.4 (24.0,33.3) 0.2 (0.0,1.2) 0.0 (,) (25.5,32.4) 28.7 (25.3,32.3) 28.5 (25.1,32.1) 0.5 (0.2,1.3) 0.7 (0.3,1.9) (26.3,34.0) 29.8 (26.1,33.7) 29.6 (26.0,33.6) 0.9 (0.5,1.6) 0.5 (0.2,1.4) (31.3,38.1) 34.5 (31.1,37.9) 34.1 (30.8,37.6) 1.7 (1.0,2.9) 0.5 (0.2,0.9) (32.7,40.3) 35.6 (31.8,39.6) 34.5 (30.7,38.4) 2.4 (1.4,3.8) 0.9 (0.4,2.1) (32.6,38.7) 34.6 (31.3,38.1) 32.3 (28.7,36.1) 4.8 (3.0,7.6) 1.6 (0.7,3.6) (28.4,36.3) 31.7 (27.9,35.7) 29.7 (26.1,33.7) 5.2 (3.2,8.4) 0.9 (0.5,1.9) (25.1,33.3) 28.0 (24.2,32.2) 24.8 (21.5,28.5) 5.8 (3.4,9.8) 1.5 (0.8,2.6) (21.7,31.0) 25.2 (20.8,30.1) 21.5 (17.7,25.9) 5.4 (3.3,8.5) 1.5 (0.7,3.5) Residence Urban 27.1 (24.8,29.4) 27.0 (24.7,29.3) 26.7 (24.5,29.1) 0.8 (0.5,1.3) 0.3 (0.2,0.6) Rural 30.0 (27.7,32.4) 29.4 (27.1,31.9) 28.1 (25.9,30.4) 3.1 (2.0,4.7) 1.0 (0.6,1.8) EducationLevel 3 PrimarySchoolorLess 24.9 (22.0,28.1) 24.0 (21.2,27.1) 21.5 (18.8,24.4) 4.8 (3.4,6.6) 1.5 (0.8,2.8) AttendedSecondarySchool 36.8 (34.7,39.0) 36.4 (34.4,38.5) 35.6 (33.5,37.7) 2.6 (1.6,4.2) 0.5 (0.3,1.0) HighSchoolGraduate 35.5 (32.0,39.2) 35.3 (31.7,39.0) 35.2 (31.6,38.9) 0.7 (0.4,1.3) 0.7 (0.3,1.9) CollegeGraduateorAbove 27.0 (23.6,30.7) 27.0 (23.6,30.7) 27.0 (23.6,30.7) 0.1 (0.0,0.7) 0.3 (0.1,0.8) Occupation AgricultureWorker 30.9 (27.8,34.2) 30.1 (26.9,33.5) 28.1 (24.9,31.4) 4.4 (3.0,6.4) 1.3 (0.7,2.5) MachineOperator 51.0 (46.1,56.0) 50.8 (45.9,55.6) 50.3 (45.5,55.1) 1.1 (0.6,2.1) 0.6 (0.3,1.2) BusinessorServiceEmployee 29.6 (25.9,33.6) 29.5 (25.8,33.5) 29.1 (25.4,33.2) 1.0 (0.5,1.8) 0.5 (0.2,1.0) LeadersofOrganizations 36.3 (30.4,42.6) 35.9 (30.1,42.2) 35.9 (30.1,42.2) 0.2 (0.1,0.5) 0.6 (0.1,2.7) Clerks 35.2 (26.6,45.0) 35.2 (26.6,45.0) 35.2 (26.6,45.0) 0.9 (0.3,2.2) 0.0 (,) SpecializedTechnicians 38.6 (30.7,47.1) 38.6 (30.7,47.1) 38.6 (30.7,47.1) 0.8 (0.3,2.3) 0.1 (0.0,0.6) Medical/HealthPersonnel 16.5 (10.7,24.7) 15.6 (10.0,23.7) 15.6 (10.0,23.7) 2.6 (0.4,16.2) 0.0 (,) TeachingStaff 14.5 (8.9,22.9) 14.4 (8.7,22.8) 14.4 (8.7,22.8) 0.0 (,) 0.1 (0.0,1.0) Soldiers 47.4 (14.7,82.5)* 47.4 (14.7,82.5)* 47.4 (14.7,82.5)* 0.0 (,)* 20.2 (2.8,69.0)* Students 1.2 (0.6,2.7) 1.2 (0.6,2.7) 1.2 (0.6,2.7) 0.0 (,) 0.0 (,) NoJobs 14.5 (10.6,19.5) 14.4 (10.5,19.4) 13.7 (10.1,18.4) 1.5 (0.8,2.7) 0.2 (0.1,0.8) Retired 18.9 (15.0,23.6) 18.7 (14.8,23.4) 18.3 (14.4,22.9) 1.0 (0.5,2.2) 0.9 (0.2,3.9) Others 42.9 (32.2,54.3) 42.9 (32.2,54.3) 42.9 (32.2,54.3) 0.9 (0.2,4.1) 0.0 (,) Region East 27.1 (24.9,29.4) 26.9 (24.8,29.2) 26.1 (24.1,28.2) 2.3 (1.1,4.8) 0.2 (0.1,0.5) Central 28.5 (26.3,30.9) 28.4 (26.2,30.8) 27.3 (24.9,29.7) 2.4 (1.5,3.7) 0.5 (0.2,1.0) West 30.6 (27.0,34.4) 29.7 (26.1,33.6) 29.1 (25.6,32.9) 1.4 (0.8,2.4) 1.5 (0.8,2.7) Note:Currentuseincludesbothdailyandoccasional(lessthandaily)use. 1 Includesmanufacturedandhandrolledcigarettes. 2 Includespipes,cigarsandcigarillos,waterpipes,andothersmokedtobaccoproductsthanmanufacturedandhandrolledcigarettes. 3 Educationlevelisreportedonlyamongrespondents25+yearsold. *Estimatebasedonlessthan25unweightedcases. 139
166 Table4.11(cont.):Percentageofadults15to69yearsoldwhoarecurrentsmokersofvarioussmoked tobaccoproducts,bygenderandselecteddemographiccharacteristics(2) GATSChina,2010. DemographicCharacteristics AnySmokedTobacco Product AnyCigarette 1 Manufactured Percentage(95%CI) TypeofCigarette Handrolled OtherSmoked Tobacco 2 Male 54.0 (51.6,56.3) 53.3 (50.9,55.7) 52.0 (49.6,54.3) 3.5 (2.3,5.3) 1.3 (0.8,2.1) Age(years) (8.0,23.8) 14.2 (8.0,23.8) 14.2 (8.0,23.8) 0.0 (,) 0.0 (0.0,0.0) (40.8,57.3) 48.8 (40.4,57.2) 48.8 (40.4,57.2) 0.8 (0.2,3.1) 1.3 (0.4,3.6) (45.5,60.5) 53.0 (45.4,60.4) 53.0 (45.4,60.4) 0.4 (0.1,2.4) 0.0 (,) (47.1,58.6) 52.5 (46.8,58.2) 52.2 (46.5,57.9) 0.9 (0.4,2.4) 1.3 (0.5,3.6) (51.6,64.4) 57.6 (51.2,63.7) 57.5 (51.1,63.6) 1.5 (0.7,2.9) 1.0 (0.4,2.7) (64.0,73.5) 68.7 (63.8,73.3) 68.0 (63.0,72.6) 3.5 (2.1,6.0) 0.8 (0.4,1.7) (64.5,74.1) 68.0 (62.7,72.8) 66.7 (61.4,71.7) 3.6 (2.2,5.9) 1.7 (0.8,3.9) (58.2,67.7) 61.5 (56.0,66.7) 58.0 (52.0,63.7) 7.6 (4.4,12.8) 2.8 (1.2,6.2) (56.3,67.2) 60.8 (55.2,66.1) 57.7 (52.2,63.0) 9.4 (5.6,15.5) 1.7 (0.9,3.4) (48.0,61.6) 53.0 (46.2,59.7) 47.3 (40.9,53.8) 10.6 (6.1,17.8) 2.9 (1.7,5.1) (38.4,53.3) 43.9 (36.6,51.5) 37.6 (30.8,44.8) 9.8 (6.3,14.8) 3.2 (1.4,7.2) Residence Urban 51.0 (47.9,54.1) 50.8 (47.7,53.8) 50.4 (47.2,53.5) 1.3 (0.8,2.1) 0.7 (0.4,1.2) Rural 56.5 (52.8,60.1) 55.4 (51.7,59.1) 53.3 (49.7,56.9) 5.4 (3.4,8.4) 1.9 (1.1,3.2) EducationLevel 3 PrimarySchoolorLess 62.8 (57.4,67.8) 60.5 (55.3,65.4) 55.2 (50.1,60.2) 10.9 (7.6,15.4) 3.9 (2.1,7.2) AttendedSecondarySchool 64.7 (61.6,67.7) 64.1 (61.0,67.0) 62.6 (59.3,65.8) 4.5 (2.7,7.3) 0.9 (0.4,1.6) HighSchoolGraduate 59.5 (54.6,64.3) 59.1 (54.0,64.1) 58.9 (53.8,63.9) 1.2 (0.7,2.2) 1.2 (0.4,3.4) CollegeGraduateorAbove 45.2 (39.7,50.8) 45.2 (39.7,50.8) 45.2 (39.7,50.8) 0.2 (0.0,1.2) 0.5 (0.1,1.5) Occupation AgricultureWorker 61.2 (55.8,66.4) 59.6 (54.3,64.7) 56.3 (50.7,61.6) 8.2 (5.5,12.1) 2.6 (1.3,5.0) MachineOperator 67.0 (62.0,71.7) 66.6 (61.7,71.2) 66.1 (61.2,70.6) 1.5 (0.8,2.7) 0.8 (0.4,1.6) BusinessorServiceEmployee 59.1 (53.7,64.3) 58.9 (53.5,64.1) 58.2 (52.7,63.5) 1.9 (1.0,3.4) 0.9 (0.4,2.0) LeadersofOrganizations 54.2 (45.0,63.2) 53.6 (44.5,62.5) 53.6 (44.5,62.5) 0.3 (0.1,0.8) 1.0 (0.2,4.2) Clerks 55.5 (40.7,69.5) 55.5 (40.7,69.5) 55.5 (40.7,69.5) 1.2 (0.4,3.4) 0.0 (,) SpecializedTechnicians 52.0 (42.2,61.7) 52.0 (42.2,61.7) 52.0 (42.2,61.7) 1.0 (0.4,3.0) 0.2 (0.0,0.8) Medical/HealthPersonnel 40.5 (26.8,55.8) 38.3 (25.0,53.6) 38.3 (25.0,53.6) 6.5 (1.0,33.2) 0.0 (,) TeachingStaff 36.9 (22.3,54.5) 36.6 (21.9,54.2) 36.6 (21.9,54.2) 0.0 (,) 0.4 (0.0,2.7) Soldiers 47.5 (14.7,82.5)* 47.5 (14.7,82.5)* 47.5 (14.7,82.5)* 0.0 (,)* 20.2 (2.8,69.1)* Students 1.5 (0.5,4.0) 1.5 (0.5,4.0) 1.5 (0.5,4.0) 0.0 (,) 0.0 (,) NoJobs 50.9 (43.0,58.7) 50.6 (42.7,58.4) 49.1 (41.7,56.5) 3.6 (2.0,6.6) 0.8 (0.2,3.0) Retired 44.4 (36.6,52.6) 44.1 (36.3,52.2) 43.4 (35.6,51.5) 2.2 (1.0,4.8) 2.1 (0.4,10.0) Others 63.0 (48.2,75.7) 63.0 (48.2,75.7) 63.0 (48.2,75.7) 1.4 (0.3,5.9) 0.0 (,) Region East 50.1 (46.4,53.8) 49.8 (46.1,53.6) 48.3 (44.8,51.9) 4.2 (1.9,8.8) 0.4 (0.2,1.0) Central 52.4 (48.9,55.8) 52.2 (48.7,55.6) 50.9 (47.2,54.6) 3.4 (2.1,5.4) 0.9 (0.4,1.9) West 60.1 (55.0,64.9) 58.5 (53.4,63.5) 57.4 (52.4,62.3) 2.7 (1.7,4.4) 2.8 (1.5,5.1) Note:Currentuseincludesbothdailyandoccasional(lessthandaily)use. 1 Includesmanufacturedandhandrolledcigarettes. 2 Includespipes,cigarsandcigarillos,waterpipes,andothersmokedtobaccoproductsthanmanufacturedandhandrolledcigarettes. 3 Educationlevelisreportedonlyamongrespondents25+yearsold. *Estimatebasedonlessthan25unweightedcases. 140
167 Table4.11(cont.):Percentageofadults15to69yearsoldwhoarecurrentsmokersofvarioussmoked tobaccoproducts,bygenderandselecteddemographiccharacteristics(2) GATSChina,2010. DemographicCharacteristics AnySmokedTobacco Product AnyCigarette 1 Manufactured Percentage(95%CI) TypeofCigarette Handrolled OtherSmoked Tobacco 2 Female 2.1 (1.6,2.8) 2.0 (1.5,2.7) 1.7 (1.3,2.3) 0.5 (0.3,0.7) 0.1 (0.0,0.4) Age(years) (0.3,2.7) 0.9 (0.3,2.7) 0.9 (0.3,2.7) 0.0 (,) 0.0 (,) (0.1,3.0) 0.6 (0.1,3.0) 0.6 (0.1,3.0) 0.1 (0.0,0.7) 0.0 (,) (0.1,0.9) 0.3 (0.1,0.9) 0.3 (0.1,0.9) 0.0 (0.0,0.1) 0.0 (,) (0.0,1.5) 0.3 (0.0,1.5) 0.3 (0.0,1.5) 0.0 (0.0,0.2) 0.0 (,) (0.6,2.3) 1.2 (0.6,2.3) 1.1 (0.5,2.3) 0.2 (0.1,0.8) 0.0 (,) (1.8,6.1) 3.2 (1.7,6.0) 3.2 (1.7,6.0) 0.1 (0.0,0.5) 0.1 (0.0,1.0) (1.7,4.9) 2.8 (1.6,4.8) 1.8 (1.0,3.3) 1.1 (0.3,3.3) 0.1 (0.0,0.8) (2.4,7.0) 4.0 (2.3,6.8) 2.9 (1.5,5.4) 1.6 (0.7,3.7) 0.2 (0.0,1.2) (1.5,6.0) 2.9 (1.4,5.9) 2.2 (1.0,4.5) 1.1 (0.4,2.7) 0.1 (0.0,0.8) (1.4,4.6) 2.5 (1.4,4.6) 1.8 (1.0,3.5) 0.9 (0.4,2.3) 0.0 (,) (4.5,14.2) 8.1 (4.5,14.2) 6.8 (3.4,13.2) 1.3 (0.4,4.0) 0.0 (,) Residence Urban 2.3 (1.5,3.4) 2.3 (1.5,3.4) 2.2 (1.5,3.3) 0.2 (0.1,0.7) 0.0 (,) Rural 1.9 (1.3,2.8) 1.8 (1.3,2.6) 1.3 (0.9,1.9) 0.7 (0.4,1.1) 0.1 (0.0,0.7) EducationLevel 3 PrimarySchoolorLess 3.6 (2.6,4.9) 3.5 (2.6,4.8) 2.5 (1.7,3.6) 1.3 (0.8,2.3) 0.1 (0.0,0.6) AttendedSecondarySchool 2.2 (1.3,3.6) 2.1 (1.2,3.5) 2.0 (1.1,3.4) 0.2 (0.1,0.6) 0.1 (0.0,0.5) HighSchoolGraduate 2.0 (0.7,5.4) 1.9 (0.6,5.4) 1.9 (0.6,5.4) 0.0 (0.0,0.2) 0.1 (0.0,0.5) CollegeGraduateorAbove 0.6 (0.3,1.5) 0.6 (0.3,1.5) 0.6 (0.3,1.5) 0.0 (,) 0.0 (,) Occupation AgricultureWorker 2.7 (1.8,4.0) 2.6 (1.7,3.9) 1.8 (1.2,2.8) 0.9 (0.5,1.6) 0.1 (0.0,0.7) MachineOperator 0.8 (0.3,1.9) 0.8 (0.3,1.9) 0.8 (0.3,1.9) 0.0 (,) 0.0 (,) BusinessorServiceEmployee 1.5 (0.7,3.3) 1.5 (0.6,3.3) 1.5 (0.6,3.3) 0.1 (0.0,0.5) 0.1 (0.0,0.4) LeadersofOrganizations 4.1 (0.9,16.6) 4.1 (0.9,16.6) 4.1 (0.9,16.6) 0.0 (,) 0.0 (,) Clerks 0.9 (0.2,4.2) 0.9 (0.2,4.2) 0.9 (0.2,4.2) 0.2 (0.0,1.8) 0.0 (,) SpecializedTechnicians 0.0 (,) 0.0 (,) 0.0 (,) 0.0 (,) 0.0 (,) Medical/HealthPersonnel 0.0 (,) 0.0 (,) 0.0 (,) 0.0 (,) 0.0 (,) TeachingStaff 0.0 (,) 0.0 (,) 0.0 (,) 0.0 (,) 0.0 (,) Soldiers 0.0 (,)* 0.0 (,)* 0.0 (,)* 0.0 (,)* 0.0 (,)* Students 0.9 (0.2,3.9) 0.9 (0.2,3.9) 0.9 (0.2,3.9) 0.0 (,) 0.0 (,) NoJobs 2.4 (1.2,4.6) 2.4 (1.2,4.6) 2.0 (1.0,4.0) 0.8 (0.3,2.2) 0.0 (,) Retired 3.0 (1.6,5.7) 2.9 (1.5,5.6) 2.7 (1.4,5.1) 0.3 (0.1,1.4) 0.1 (0.0,0.8) Others 4.0 (1.0,14.2)* 4.0 (1.0,14.2)* 4.0 (1.0,14.2)* 0.0 (,)* 0.0 (,)* Region East 1.4 (0.7,2.6) 1.4 (0.7,2.6) 1.3 (0.7,2.6) 0.1 (0.1,0.3) 0.0 (,) Central 3.8 (2.7,5.4) 3.8 (2.7,5.4) 2.8 (1.9,4.2) 1.3 (0.8,2.3) 0.0 (,) West 1.6 (1.0,2.5) 1.4 (0.8,2.3) 1.3 (0.8,2.2) 0.1 (0.0,0.5) 0.2 (0.0,1.0) Note:Currentuseincludesbothdailyandoccasional(lessthandaily)use. 1 Includesmanufacturedandhandrolledcigarettes. 2 Includespipes,cigarsandcigarillos,waterpipes,andothersmokedtobaccoproductsthanmanufacturedandhandrolledcigarettes. 3 Educationlevelisreportedonlyamongrespondents25+yearsold. *Estimatebasedonlessthan25unweightedcases. 141
168 Table4.12:Percentageofeversmokers15yearsoldwhoareformersmokers,andcurrent smokers>=15yearsoldwhohavetriedtoquit,byselecteddemographiccharacteristics GATSChina, Demographic Characteristics FormerSmokers 1 (AmongEverSmokers) CurrentSmokersWhoTried QuittinginPast12Months Percentage(95%CI) CurrentSmokersWhoEver TriedQuitting Overall 16.0 (14.0,18.4) 11.6 (9.4,14.1) 37.5 (33.8,41.4) Gender Male 15.7 (13.6,18.0) 11.5 (9.3,14.1) 37.6 (33.7,41.6) Female 23.1 (17.5,29.9) 13.2 (8.8,19.5) 36.1 (28.1,45.0) Age(years) (3.9,14.6) 19.0 (10.5,31.8) 30.3 (20.2,42.8) (7.7,13.4) 10.1 (8.0,12.8) 35.9 (31.7,40.3) (16.5,21.6) 10.2 (8.1,12.8) 42.6 (37.8,47.5) (33.2,43.3) 12.6 (9.2,17.1) 36.6 (31.3,42.3) Residence Urban 16.9 (13.7,20.6) 9.4 (7.3,12.1) 36.1 (31.8,40.6) Rural 15.4 (13.0,18.2) 13.2 (10.2,16.9) 38.6 (33.3,44.3) EducationLevel 2 PrimarySchoolorLess 22.6 (19.3,26.2) 10.2 (7.8,13.2) 35.5 (31.5,39.8) AttendedSecondarySchool 13.3 (10.9,16.1) 10.7 (8.7,13.0) 39.9 (35.9,44.0) HighSchoolGraduate 17.9 (13.4,23.5) 9.9 (7.1,13.6) 41.5 (35.5,47.7) CollegeGraduateorAbove 16.4 (12.8,20.8) 10.9 (7.8,15.1) 35.9 (29.9,42.3) Occupation AgricultureWorker 14.7 (11.7,18.3) 12.5 (9.2,16.9) 37.6 (30.7,44.9) MachineOperator 8.0 (5.4,11.6) 11.3 (7.1,17.6) 35.2 (27.7,43.6) BusinessorServiceEmployee 10.5 (7.6,14.5) 12.5 (9.4,16.5) 37.1 (31.3,43.4) Leadersoforganizations 12.7 (6.4,23.8) 9.9 (6.2,15.4) 38.9 (30.8,47.7) Clerks 6.6 (3.0,13.9) 15.9 (6.0,35.7) 36.9 (23.0,53.3) SpecializedTechnicians 13.9 (8.5,21.9) 5.0 (2.7,9.2) 33.2 (25.0,42.5) Medical/HealthPersonnel 20.9 (9.6,39.8) 16.4 (6.5,35.7) 45.6 (24.1,69.0) TeachingStaff 23.7 (10.9,44.1) 14.3 (4.9,35.0) 39.7 (22.1,60.6) Soldiers 0.0 (,)* 13.8 (1.4,64.2)* 13.8 (1.4,64.2)* Students 68.4 (34.0,90.1)* 0.2 (0.0,1.6)* 31.1 (7.7,70.9)* NoJobs 26.8 (20.9,33.6) 11.7 (6.3,20.7) 36.9 (28.1,46.6) Retired 39.6 (33.6,46.0) 10.1 (6.8,14.8) 48.5 (39.7,57.3) Others 19.8 (6.4,47.2) 11.2 (3.3,32.1) 36.0 (18.0,59.0) Region East 17.6 (13.8,22.1) 10.4 (6.6,16.2) 34.9 (29.2,41.1) Central 17.9 (14.4,22.0) 13.5 (10.9,16.8) 41.7 (36.8,46.7) West 13.0 (9.6,17.3) 11.2 (8.1,15.4) 37.0 (29.8,44.7) 1 Currentnonsmokers. 2 Educationlevelisreportedonlyamongrespondents25+yearsold. *Estimatebasedonlessthan25unweightedcases. 142
169 Table4.13:Percentageofeversmokers15yearsoldwhoareeversmokers,byselecteddemographic characteristics GATSChina,2010. Demographic Characteristics Overall Male Female Percentage(95%CI) Overall 33.5 (31.7,35.3) 62.8 (60.4,65.1) 3.1 (2.5,3.9) Age(years) (16.0,23.3) 36.3 (30.6,42.4) 0.8 (0.3,2.0) (32.5,36.6) 65.9 (63.0,68.6) 1.9 (1.3,2.9) (39.1,44.0) 77.7 (74.9,80.3) 3.9 (2.9,5.3) (33.4,40.0) 65.7 (60.7,70.5) 10.1 (7.6,13.5) Residence Urban 31.4 (28.9,34.1) 58.9 (55.8,62.0) 3.4 (2.5,4.5) Rural 35.3 (32.9,37.8) 66.0 (62.5,69.3) 2.9 (2.0,4.2) EducationLevel 1 PrimarySchoolorLess 31.8 (29.2,34.4) 75.6 (72.2,78.7) 5.8 (4.4,7.5) AttendedSecondarySchool 41.6 (39.4,43.9) 72.8 (70.0,75.4) 2.6 (1.7,4.0) HighSchoolGraduate 42.5 (38.9,46.2) 71.0 (67.3,74.5) 2.1 (0.8,5.2) CollegeGraduateorAbove 31.8 (28.2,35.7) 52.4 (46.8,57.9) 1.1 (0.6,2.0) Occupation AgricultureWorker 35.9 (33.1,38.9) 70.5 (65.8,74.8) 3.7 (2.4,5.6) MachineOperator 55.4 (50.1,60.7) 72.7 (66.8,77.8) 1.1 (0.4,2.8) BusinessorServiceEmployee 33.2 (29.0,37.6) 65.9 (60.0,71.3) 1.9 (1.0,3.7) Leadersoforganizations 41.5 (36.0,47.4) 62.2 (55.4,68.6) 4.3 (1.0,16.3) Clerks 37.7 (29.2,47.1) 59.5 (44.4,73.0) 0.9 (0.2,4.2) SpecializedTechnicians 45.2 (37.3,53.3) 60.8 (51.8,69.1) 0.0 (,) Medical/HealthPersonnel 21.1 (14.8,29.0) 51.1 (37.1,65.0) 0.0 (,) TeachingStaff 19.1 (12.4,28.4) 47.8 (31.1,65.1) 0.0 (,) Soldiers 47.4 (14.7,82.5)* 47.5 (14.7,82.5)* 0.0 (,)* Students 3.9 (1.7,8.6) 6.1 (2.7,13.1) 0.9 (0.2,3.9) NoJobs 19.7 (15.1,25.2) 67.0 (60.2,73.2) 4.4 (2.8,7.0) Retired 30.6 (26.7,34.8) 63.9 (56.7,70.5) 4.7 (2.8,7.8) Others 48.2 (37.9,58.5) 70.3 (54.6,82.4) 6.0 (1.9,17.3) Region East 31.8 (28.9,34.8) 58.8 (54.6,62.8) 2.2 (1.4,3.4) Central 34.3 (32.1,36.6) 62.2 (58.9,65.4) 5.4 (3.9,7.6) West 34.9 (31.2,38.8) 68.1 (63.9,72.0) 2.3 (1.5,3.5) 1 Educationlevelisreportedonlyamongrespondents25+yearsold. *Estimatebasedonlessthan25unweightedcases. 143
170 Table4.14:Numberofeversmokers15yearsoldwhoareeversmokers,byselecteddemographic characteristics GATSChina,2010. Demographic Characteristics Overall Male Female WeightedNumberinThousands Overall 358, ,767 16,393 Age(years) ,544 43, , ,644 3, , ,565 5, ,499 32,928 5,571 Residence Urban 154, ,496 8,264 Rural 203, ,270 8,130 EducationLevel 2 PrimarySchoolorLess 88,713 78,571 10,142 AttendedSecondarySchool 126, ,442 3,540 HighSchoolGraduate 66,906 65,528 1,378 CollegeGraduateorAbove 30,921 30, Occupation AgricultureWorker 121, ,038 6,456 MachineOperator 64,163 63, BusinessorServiceEmployee 55,453 53,799 1,653 Leadersoforganizations 23,102 22, Clerks 7,028 6, SpecializedTechnicians 19,205 19,205 0 Medical/HealthPersonnel 3,760 3,760 0 TeachingStaff 3,178 3,178 0 Soldiers Students 2,675 2, NoJobs 23,092 19,144 3,948 Retired 31,519 28,814 2,705 Others 2,753 2, Region East 132, ,705 4,316 Central 100,063 92,234 7,828 West 126, ,827 4,248 1 Currentnonsmokers. 2 Educationlevelisreportedonlyamongrespondents25+yearsold. *Estimatebasedonlessthan25unweightedcases. 144
171 Table4.15:Percentageofeversmokers1569yearsoldwhoareeversmokers,byselecteddemographic characteristics GATSChina,2010. Demographic Characteristics Overall Male Female Percentage(95%CI) Overall 33.3 (31.4,35.3) 62.7 (60.2,65.1) 2.5 (2.0,3.3) Age(years) (16.0,23.3) 36.3 (30.6,42.4) 0.8 (0.3,2.0) (32.5,36.6) 65.9 (63.0,68.6) 1.9 (1.3,2.9) (39.1,44.0) 77.7 (74.9,80.3) 3.9 (2.9,5.3) (33.4,42.7) 68.4 (61.5,74.5) 8.8 (5.5,14.0) Residence Urban 31.4 (28.7,34.2) 59.1 (55.9,62.3) 2.7 (1.8,3.9) Rural 35.0 (32.5,37.6) 65.7 (61.9,69.2) 2.5 (1.7,3.6) EducationLevel 1 PrimarySchoolorLess 30.9 (28.0,33.8) 77.3 (73.1,81.1) 4.4 (3.2,6.0) AttendedSecondarySchool 41.8 (39.6,44.1) 73.4 (70.7,75.9) 2.6 (1.7,4.0) HighSchoolGraduate 42.5 (38.8,46.3) 71.3 (67.6,74.9) 2.1 (0.8,5.3) CollegeGraduateorAbove 31.6 (27.8,35.6) 52.7 (47.0,58.4) 0.8 (0.4,1.7) Occupation AgricultureWorker 35.7 (32.7,38.9) 70.5 (65.5,75.0) 3.2 (2.1,5.0) MachineOperator 55.5 (50.1,60.7) 72.7 (66.9,77.9) 1.1 (0.4,2.8) BusinessorServiceEmployee 33.1 (29.0,37.6) 65.9 (60.0,71.3) 1.9 (1.0,3.7) Leadersoforganizations 41.4 (35.9,47.2) 62.1 (55.3,68.5) 4.3 (1.0,16.3) Clerks 37.7 (29.2,47.1) 59.5 (44.4,73.0) 0.9 (0.2,4.2) SpecializedTechnicians 44.9 (37.1,53.1) 60.5 (51.6,68.9) 0.0 (,) Medical/HealthPersonnel 20.9 (14.7,28.9) 51.0 (36.9,64.9) 0.0 (,) TeachingStaff 18.8 (12.1,28.0) 47.2 (30.5,64.6) 0.0 (,) Soldiers 47.4 (14.7,82.5)* 47.5 (14.7,82.5)* 0.0 (,)* Students 3.9 (1.7,8.6) 6.1 (2.7,13.1) 0.9 (0.2,3.9) NoJobs 19.2 (14.2,25.3) 67.7 (59.6,74.9) 3.2 (1.7,5.8) Retired 28.1 (23.5,33.3) 66.8 (58.3,74.3) 3.4 (1.9,6.1) Others 44.7 (33.8,56.2) 66.6 (49.2,80.4) 3.8 (1.0,13.6)* Region East 31.9 (28.8,35.1) 58.9 (54.5,63.2) 1.7 (1.0,2.8) Central 34.0 (31.7,36.3) 62.0 (58.6,65.3) 4.8 (3.3,6.8) West 34.5 (30.6,38.7) 67.9 (63.5,72.0) 1.7 (1.1,2.7) 1Educationlevelisreportedonlyamongrespondents25+yearsold. *Estimatebasedonlessthan25unweightedcases. 145
172 Table4.16:Numberofeversmokers1569yearsoldwhoareeversmokers,byselecteddemographic characteristics GATSChina,2010. Demographic Characteristics Overall Male Female WeightedNumberinThousands Overall 333, ,646 12,416 Age(years) ,544 43, , ,644 3, , ,565 5, ,401 11,808 1,594 Residence Urban 144, ,346 6,005 Rural 188, ,300 6,411 EducationLevel 2 PrimarySchoolorLess 69,555 63,192 6,363 AttendedSecondarySchool 124, ,899 3,450 HighSchoolGraduate 64,753 63,388 1,365 CollegeGraduateorAbove 29,776 29, Occupation AgricultureWorker 111, ,594 5,197 MachineOperator 64,079 63, BusinessorServiceEmployee 55,250 53,635 1,615 Leadersoforganizations 23,000 22, Clerks 7,028 6, SpecializedTechnicians 19,030 19,030 0 Medical/HealthPersonnel 3,723 3,723 0 TeachingStaff 3,103 3,103 0 Soldiers Students 2,675 2, NoJobs 20,280 17,751 2,529 Retired 20,348 18,835 1,513 Others 2,028 1, Region East 124, ,346 3,123 Central 92,698 86,325 6,373 West 115, ,976 2,920 1 Educationlevelisreportedonlyamongrespondents25+yearsold. *Estimatebasedonlessthan25unweightedcases. 146
173 Table4.17:Averageconsumptionperdayofmanufacturedcigarettesamongmanufacturedcigarette smokers15yearsold,byselecteddemographiccharacteristics GATSChina,2010. Demographic Characteristics CigaretteConsumptionPerDay 1 Overall Male Female Average(95%CI) N Average(95%CI) N Average(95%CI) N Overall 14.2 (13.6,14.7) 3, (13.7,14.9) 3, (9.0,12.1) 173 Age(years) (8.5,11.3) (8.5,11.4) (1.6,11.1)* (13.2,14.6) 1, (13.3,14.7) 1, (8.6,12.2) (15.8,17.5) 1, (16.0,17.8) 1, (8.6,13.1) (11.2,13.5) (11.2,13.8) (8.6,14.4) 54 Residence Urban 13.7 (13.0,14.4) 1, (13.1,14.6) 1, (8.4,12.9) 81 Rural 14.5 (13.7,15.4) 2, (13.8,15.5) 2, (8.8,12.0) 92 EducationLevel 2 PrimarySchoolorLess 15.6 (14.5,16.7) 1, (14.9,17.3) (9.3,13.1) 110 AttendedSecondarySchool 15.5 (14.8,16.3) 1, (14.9,16.4) 1, (8.9,13.1) 37 HighSchoolGraduate 13.8 (12.8,14.8) (12.9,14.9) (6.2,12.0)* 13 CollegeGraduateorAbove 12.7 (11.5,14.0) (11.5,14.0) (3.8,19.7)* 5 Occupation AgricultureWorker 15.4 (14.3,16.5) 1, (14.5,16.7) 1, (8.9,12.5) 71 MachineOperator 14.2 (13.1,15.3) (13.1,15.3) (3.7,10.6)* 6 BusinessorService Employee 14.1 (13.0,15.1) (13.1,15.3) (4.8,14.1)* 14 LeadersofOrganizations 13.4 (11.8,14.9) (11.8,15.2) (7.5,12.2)* 5 Clerks 13.4 (11.2,15.6) (11.3,15.7) (4.4,16.7)* 2 SpecializedTechnicians 11.8 (10.1,13.5) (10.1,13.5) (,)* 0 Medical/HealthPersonnel 12.4 (8.4,16.3) (8.4,16.3) (,)* 0 TeachingStaff 13.0 (11.2,14.8) (11.2,14.8) (,)* 0 Soldiers 9.0 (7.7,10.2)* (7.7,10.2)* (,)* 0 Students 4.6 (2.4,6.8)* (1.2,5.7)* (5.0,8.9)* 2 NoJobs 13.8 (12.1,15.5) (12.1,16.2) (8.3,15.7) 40 Retired 12.9 (11.5,14.3) (11.6,14.6) (8.4,12.9) 29 Others 13.0 (8.7,17.4) (8.5,17.7) (6.2,16.6)* 4 Region East 13.6 (12.8,14.5) 1, (12.9,14.6) 1, (8.5,13.3) 47 Central 14.7 (13.6,15.8) 1, (13.8,16.1) 1, (9.2,13.2) 75 West 14.3 (13.4,15.2) 1, (13.5,15.3) 1, (6.1,12.4) 51 1 Amongthosewhosmokedatleastonemanufacturedcigaretteaweek. 2 Educationlevelisreportedonlyamongrespondents25+yearsold. *Estimatebasedonlessthan25unweightedcases. 147
174 Table4.18:Percentagedistributionofdailycigarettesmokers15yearsold,bycigarettessmokedperday,genderandselecteddemographic characteristics GATSChina,2010. Demographic Characteristics Numberofcigarettessmokedonaverageperday 1 < >=25 Total Percentage(95%CI) Overall 5.3 (3.8,7.3) 12.3 (10.4,14.4) 26.0 (22.4,29.9) 9.4 (7.6,11.6) 35.2 (31.1,39.6) 11.9 (10.1,13.9) 100 Age(years) (5.7,23.0) 22.0 (13.6,33.7) 34.7 (22.6,49.2) 11.2 (5.2,22.4) 18.9 (9.9,33.0) 1.4 (0.2,7.9) (2.0,5.1) 11.7 (9.1,14.9) 28.4 (23.5,33.8) 9.6 (7.2,12.7) 38.2 (32.9,43.8) 8.9 (7.0,11.3) (2.6,5.2) 8.4 (6.9,10.3) 20.6 (18.1,23.5) 8.7 (6.9,11.0) 39.0 (34.9,43.2) 19.6 (16.6,22.9) (9.4,19.2) 16.7 (13.0,21.2) 22.9 (18.2,28.3) 8.1 (4.9,12.9) 29.3 (23.1,36.4) 9.5 (6.4,13.9) 100 Residence Urban 4.4 (2.3,8.3) 13.8 (10.6,17.7) 30.3 (25.1,36.0) 9.0 (7.4,10.8) 31.9 (27.3,36.8) 10.6 (8.8,12.8) 100 Rural 6.0 (4.1,8.5) 11.1 (8.9,13.9) 22.7 (18.7,27.3) 9.7 (6.8,13.5) 37.7 (31.7,44.1) 12.8 (10.1,16.1) 100 EducationLevel 2 PrimarySchoolorLess 6.2 (4.3,9.0) 11.1 (8.8,13.9) 20.2 (17.2,23.4) 9.0 (6.8,11.9) 34.7 (30.2,39.5) 18.8 (15.4,22.7) 100 AttendedSecondarySchool 3.5 (2.3,5.2) 9.6 (7.5,12.1) 23.6 (19.2,28.8) 8.9 (6.6,11.8) 41.2 (35.5,47.2) 13.3 (10.2,17.0) 100 HighSchoolGraduate 3.3 (1.2,8.7) 11.3 (8.0,15.8) 29.3 (24.4,34.6) 11.0 (7.6,15.5) 35.5 (28.5,43.2) 9.6 (7.2,12.8) 100 CollegeGraduateorAbove 5.2 (2.5,10.4) 14.4 (9.5,21.1) 31.3 (22.3,42.0) 6.4 (3.9,10.6) 34.8 (27.4,43.0) 7.8 (5.0,12.0) 100 Occupation AgricultureWorker 5.8 (3.4,9.6) 9.3 (6.5,13.1) 21.1 (16.5,26.5) 10.7 (7.5,14.9) 37.7 (29.8,46.3) 15.5 (12.1,19.6) 100 MachineOperator 4.8 (2.6,8.7) 14.9 (9.3,23.2) 25.9 (20.1,32.9) 8.2 (5.4,12.3) 35.9 (27.3,45.4) 10.2 (7.3,14.2) 100 BusinessorService Employee 3.1 (1.4,6.8) 11.6 (7.8,16.8) 32.3 (23.4,42.7) 8.0 (5.4,11.7) 34.1 (26.8,42.2) 11.0 (7.8,15.2) 100 Leadersoforganizations 1.1 (0.3,3.6) 13.5 (8.2,21.6) 38.4 (27.4,50.7) 5.4 (2.0,13.9) 32.6 (23.7,43.1) 8.9 (5.2,15.1) 100 Clerks 2.5 (0.8,7.2) 8.0 (3.4,17.8) 27.0 (14.9,43.7) 12.7 (5.7,25.9) 43.2 (27.1,60.9) 6.6 (2.9,14.4) 100 SpecializedTechnicians 7.8 (3.5,16.4) 22.4 (13.9,33.8) 26.2 (16.0,39.8) 8.6 (4.7,15.4) 29.6 (21.3,39.5) 5.5 (2.5,11.4) 100 Medical/HealthPersonnel 3.7 (0.5,24.0)* 9.7 (2.9,27.5)* 25.4 (7.6,58.5)* 3.3 (0.7,14.3)* 35.6 (14.8,63.8)* 22.4 (4.7,62.8)* 100 TeachingStaff 6.6 (1.3,28.1) 10.3 (3.1,29.5) 27.8 (14.6,46.2) 7.6 (1.9,25.9) 46.5 (30.8,63.0) 1.2 (0.2,5.5)
175 Soldiers 0.0 (,)* 43.7 (5.8,90.7)* 56.3 (9.3,94.2)* 0.0 (,)* 0.0 (,)* 0.0 (,)* 100 Students 90.0 (41.0, 99.2)* 0.0 (,)* 0.0 (,)* 0.0 (,)* 10.0 (0.8,59.0)* 0.0 (,)* 100 NoJobs 7.5 (3.2,16.6) 12.2 (7.3,19.8) 21.0 (11.7,34.6) 17.0 (6.3,38.4) 27.3 (19.6,36.6) 15.1 (9.3,23.5) 100 Retired 10.7 (6.0,18.3) 11.3 (7.0,17.8) 27.5 (21.2,35.0) 9.1 (5.6,14.4) 33.9 (27.1,41.5) 7.5 (4.5,12.4) 100 Others 0.5 (0.1,3.4) 32.7 (13.0,61.3) 7.8 (2.5,21.9) 3.8 (0.9,14.1) 49.3 (34.0,64.8) 5.9 (0.9,29.2) 100 Region East 4.9 (2.5,9.4) 14.3 (11.2,18.1) 26.9 (22.9,31.3) 10.6 (7.2,15.3) 30.7 (27.3,34.4) 12.6 (9.2,16.8) 100 Central 4.0 (2.8,5.5) 13.3 (10.0,17.5) 24.8 (19.8,30.5) 6.9 (5.2,9.2) 36.9 (32.1,41.9) 14.2 (11.8,16.9) 100 West 6.7 (4.0,11.0) 9.4 (6.9,12.7) 25.9 (18.3,35.3) 10.0 (7.0,14.0) 38.6 (29.1,49.0) 9.4 (6.7,13.2)
176 Table4.18(cont.):Percentagedistributionofdailycigarettesmokers15yearsold,bycigarettessmokedperday,genderandselected demographiccharacteristics GATSChina,2010. Demographic Characteristics Numberofcigarettessmokedonaverageperday 1 < >=25 Total Percentage(95%CI) Male 5.2 (3.7,7.3) 12.1 (10.1,14.4) 25.4 (21.9,29.3) 9.5 (7.6,11.8) 35.7 (31.4,40.2) 12.1 (10.3,14.2) 100 Age(years) (5.7,23.1) 22.0 (13.5,33.7) 34.8 (22.6,49.3) 11.2 (5.2,22.5) 18.6 (9.7,32.9) 1.4 (0.2,7.9) (1.9,5.1) 11.9 (9.3,15.2) 27.4 (23.0,32.3) 9.9 (7.4,13.0) 38.7 (33.5,44.3) 9.0 (7.0,11.5) (2.6,5.3) 7.8 (6.2,9.7) 20.1 (17.5,23.1) 8.6 (6.6,11.0) 39.6 (35.4,44.0) 20.2 (17.1,23.7) (9.7,19.2) 15.9 (12.2,20.5) 22.1 (16.7,28.6) 8.9 (5.4,14.3) 29.1 (22.2,37.0) 10.3 (7.1,14.6) 100 Residence Urban 4.5 (2.3,8.4) 13.8 (10.4,18.1) 29.7 (24.7,35.2) 9.1 (7.5,11.0) 31.9 (27.2,37.0) 11.1 (9.2,13.2) 100 Rural 5.8 (4.0,8.4) 10.8 (8.5,13.6) 22.2 (18.1,26.9) 9.8 (6.9,13.8) 38.5 (32.3,45.0) 12.9 (10.1,16.3) 100 EducationLevel 2 PrimarySchoolorLess 6.1 (4.3,8.6) 10.0 (7.6,13.0) 18.4 (15.4,21.9) 9.3 (6.9,12.6) 36.0 (31.1,41.1) 20.2 (16.6,24.5) 100 AttendedSecondary School 3.4 (2.2,5.3) 9.5 (7.4,12.1) 23.1 (18.6,28.3) 8.9 (6.6,11.9) 41.7 (35.8,47.7) 13.5 (10.3,17.4) 100 HighSchoolGraduate 3.2 (1.1,8.6) 11.5 (8.0,16.1) 28.4 (23.4,34.1) 11.2 (7.7,15.9) 35.9 (28.8,43.7) 9.8 (7.3,13.0) 100 CollegeGraduateor Above 5.2 (2.6,10.5) 14.5 (9.5,21.3) 31.4 (22.3,42.2) 6.5 (3.9,10.6) 34.5 (27.0,43.0) 7.9 (5.1,12.1) 100 Occupation AgricultureWorker 5.5 (3.2,9.4) 8.8 (6.1,12.5) 20.2 (15.5,25.9) 10.9 (7.6,15.4) 38.7 (30.6,47.6) 15.8 (12.3,20.0) 100 MachineOperator 4.8 (2.5,8.7) 15.0 (9.3,23.2) 25.8 (19.9,32.7) 8.2 (5.4,12.3) 35.9 (27.4,45.5) 10.3 (7.3,14.3) 100 BusinessorService Employee 3.1 (1.4,6.9) 11.6 (7.8,16.9) 31.7 (23.6,41.2) 8.1 (5.4,12.0) 34.2 (27.1,42.1) 11.2 (8.1,15.4) 100 Leadersoforganizations 1.1 (0.3,3.7) 14.1 (8.8,22.0) 36.0 (26.0,47.4) 5.7 (2.1,14.3) 33.7 (23.9,45.1) 9.3 (5.6,15.3) 100 Clerks 2.5 (0.8,7.3) 8.1 (3.4,17.8) 27.1 (15.0,43.8) 12.7 (5.7,26.0) 43.3 (27.2,61.0) 6.3 (2.7,14.1) 100 SpecializedTechnicians 7.8 (3.5,16.4) 22.4 (13.9,33.8) 26.2 (16.0,39.8) 8.6 (4.7,15.4) 29.6 (21.3,39.5) 5.5 (2.5,11.4) 100 Medical/HealthPersonnel 3.7 (0.5,24.0)* 9.7 (2.9,27.5)* 25.4 (7.6,58.5)* 3.3 (0.7,14.3)* 35.6 (14.8,63.8)* 22.4 (4.7,62.8)*
177 TeachingStaff 6.6 (1.3,28.1) 10.3 (3.1,29.5) 27.8 (14.6,46.2) 7.6 (1.9,25.9) 46.5 (30.8,63.0) 1.2 (0.2,5.5) 100 Soldiers 0.0 (,)* 43.7 (5.8,90.7)* 56.3 (9.3,94.2)* 0.0 (,)* 0.0 (,)* 0.0 (,)* 100 Students 90.0 (41.0,99.2)* 0.0 (,)* 0.0 (,)* 0.0 (,)* 10.0 (0.8,59.0)* 0.0 (,)* 100 NoJobs 8.4 (3.5,18.7) 8.0 (3.7,16.5) 20.1 (9.6,37.2) 19.8 (7.5,42.9) 26.2 (17.4,37.4) 17.5 (10.5,27.6) 100 Retired 11.0 (6.0,19.3) 12.2 (7.4,19.4) 27.0 (20.3,34.9) 8.1 (4.7,13.5) 33.6 (26.7,41.4) 8.2 (4.8,13.6) 100 Others 0.5 (0.1,3.8)* 34.3 (13.9,62.7)* 8.2 (2.6,23.2)* 3.9 (0.9,15.3)* 46.9 (31.2,63.3)* 6.2 (1.0,30.7)* 100 Region East 5.0 (2.5,9.5) 14.4 (11.1,18.4) 26.4 (22.7,30.4) 10.8 (7.3,15.6) 30.7 (27.2,34.6) 12.8 (9.5,17.1) 100 Central 3.8 (2.7,5.5) 12.9 (9.2,17.7) 23.6 (18.5,29.7) 6.8 (4.9,9.4) 38.1 (33.0,43.4) 14.8 (12.3,17.7) 100 West 6.5 (3.9,10.7) 9.2 (6.7,12.4) 25.7 (18.2,34.9) 10.2 (7.2,14.4) 38.9 (29.4,49.4) 9.5 (6.7,13.3)
178 Table4.18(cont.):Percentagedistributionofdailycigarettesmokers15yearsold,bycigarettessmokedperday,genderandselected demographiccharacteristics GATSChina,2010. Demographic Characteristics Numberofcigarettessmokedonaverageperday 1 < >=25 Total Percentage(95%CI) Female 6.7 (3.4,12.9) 17.1 (11.8,24.2) 39.8 (31.4,48.9) 6.1 (3.5,10.3) 24.6 (17.2,33.9) 5.7 (3.1,10.0) 100 Age(years) (,)* 25.5 (2.7,80.8)* 17.0 (1.4,74.3)* 0.0 (,)* 57.5 (9.6,94.5)* 0.0 (,)* (2.0,19.4) 4.2 (0.6,23.9) 65.0 (40.4,83.6) 0.5 (0.1,3.8) 17.8 (7.0,38.2) 6.0 (1.8,18.3) (1.0,7.8) 23.0 (15.6,32.5) 31.8 (22.4,43.1) 12.7 (7.2,21.6) 23.7 (14.6,36.0) 5.9 (2.6,12.7) (4.5,29.7) 21.3 (11.1,36.9) 27.5 (15.8,43.2) 3.1 (0.8,11.6) 30.4 (14.9,52.2) 5.4 (1.6,16.7) 100 Residence Urban 3.6 (1.3,9.8) 14.4 (6.3,29.6) 42.2 (28.2,57.5) 6.5 (2.2,17.7) 32.0 (19.8,47.2) 1.4 (0.3,6.7) 100 Rural 9.7 (4.6,19.1) 19.7 (13.4,28.0) 37.6 (28.4,47.9) 5.7 (3.0,10.7) 17.6 (10.9,27.1) 9.8 (5.4,16.9) 100 EducationLevel 2 PrimarySchoolorLess 7.5 (3.5,15.6) 20.3 (14.2,28.1) 34.5 (25.7,44.5) 6.2 (4.0,9.5) 24.4 (14.4,38.1) 7.1 (3.7,13.4) 100 AttendedSecondary School 4.8 (1.1,18.6) 14.0 (5.6,31.1) 44.3 (21.7,69.6) 8.8 (2.1,30.3) 23.5 (7.2,54.8) 4.5 (1.2,15.6) 100 HighSchoolGraduate 8.2 (0.7,53.0)* 3.2 (0.3,28.3)* 73.8 (24.1,96.2)* 0.0 (,)* 14.8 (2.0,59.3)* 0.0 (,)* 100 CollegeGraduateor Above 0.0 (,)* 0.0 (,)* 23.5 (2.5,78.4)* 0.0 (,)* 76.5 (21.6,97.5)* 0.0 (,)* 100 Occupation AgricultureWorker 10.9 (5.2,21.7) 18.1 (12.1,26.2) 37.7 (28.2,48.2) 5.8 (2.6,12.4) 16.7 (9.4,28.0) 10.8 (5.7,19.5) 100 MachineOperator 15.0 (1.6,65.1)* 0.0 (,)* 74.9 (17.1,97.7)* 0.0 (,)* 10.1 (1.2,51.0)* 0.0 (,)* 100 BusinessorService Employee 0.0 (,)* 11.2 (2.3,40.4)* 58.2 (16.5,90.8)* 0.0 (,)* 30.5 (5.7,76.1)* 0.0 (,)* 100 Leadersoforganizations 0.0 (,)* 0.0 (,)* 90.9 (39.0,99.4)* 0.0 (,)* 9.1 (0.6,61.0)* 0.0 (,)* 100 Clerks 0.0 (,)* 0.0 (,)* 0.0 (,)* 0.0 (,)* 0.0 (,)* (,)* 100 SpecializedTechnicians 0.0 (,)* 0.0 (,)* 0.0 (,)* 0.0 (,)* 0.0 (,)* 0.0 (,)* 100 Medical/HealthPersonnel 0.0 (,)* 0.0 (,)* 0.0 (,)* 0.0 (,)* 0.0 (,)* 0.0 (,)* 100 TeachingStaff 0.0 (,)* 0.0 (,)* 0.0 (,)* 0.0 (,)* 0.0 (,)* 0.0 (,)*
179 Soldiers 0.0 (,)* 0.0 (,)* 0.0 (,)* 0.0 (,)* 0.0 (,)* 0.0 (,)* 100 Students 0.0 (,)* 0.0 (,)* 0.0 (,)* 0.0 (,)* 0.0 (,)* 0.0 (,)* 100 NoJobs 3.0 (1.0,8.6) 32.5 (17.5,52.2) 25.1 (12.9,43.3) 3.4 (0.8,13.8) 32.4 (13.2,60.1) 3.6 (1.0,11.9) 100 Retired 7.7 (1.8,27.7)* 1.8 (0.2,12.2)* 33.3 (18.8,51.8)* 20.1 (6.5,47.8)* 37.1 (19.2,59.4)* 0.0 (,)* 100 Others 0.0 (,)* 0.0 (,)* 0.0 (,)* 0.0 (,)* (,)* 0.0 (,)* 100 Region East 2.7 (0.7,9.9) 12.1 (4.3,29.6) 46.9 (32.7,61.7) 4.9 (0.9,22.5) 30.3 (21.0,41.6) 3.0 (0.6,14.6) 100 Central 5.6 (2.5,12.4) 18.8 (12.7,26.9) 38.9 (31.2,47.2) 8.6 (4.8,14.8) 21.8 (11.4,37.8) 6.2 (3.0,12.6) 100 West 13.1 (3.7,37.2) 18.6 (7.9,37.6) 34.6 (13.8,63.7) 1.7 (0.3,8.9) 24.9 (12.8,42.6) 7.1 (2.4,19.0) 100 1Amongdailycigarettesmokers.Cigarettesincludemanufacturedandhandrolled. 2Educationlevelisreportedonlyamongrespondents25+yearsold. *Estimatebasedonlessthan25unweightedcases. 153
180 Table4.19:Meanageatdailysmokinginitiationamongcurrentdailycigarettesmokers,byageand selecteddemographicvariables GATSChina,2010. Demographic Characteristics AgeofRespondents Overall 15 24Yrs 25 44Yrs 45 64Yrs 65+Yrs MeanInitiationAgeinYrs(95%CI) Overall 21.2 (20.9,21.5) 18.5 (17.9,19.0) 20.6 (20.3,21.0) 22.1 (21.7,22.6) 24.9 (23.6,26.1) Gender Male 21.0 (20.7,21.2) 18.5 (17.9,19.0) 20.5 (20.1,20.8) 21.9 (21.5,22.3) 23.8 (22.8,24.8) Female 28.0 (25.6,30.5) 16.9 (15.2,18.5)* 26.7 (24.7,28.7) 27.2 (24.1,30.3) 31.1 (26.1,36.2) Residence Urban 21.3 (20.8,21.8) 18.7 (17.7,19.7) 20.8 (20.2,21.4) 21.7 (21.0,22.4) 26.2 (24.1,28.3) Rural 21.2 (20.8,21.6) 18.4 (17.7,19.0) 20.5 (20.1,20.9) 22.5 (22.0,23.0) 24.1 (22.7,25.6) EducationLevel PrimarySchoolorLess 21.9 (21.2,22.7) 17.0 (16.0,18.0)* 19.6 (18.9,20.3) 22.1 (21.3,22.8) 24.5 (22.8,26.2) AttendedSecondary School 20.7 (20.4,21.1) 18.3 (17.6,19.0) 20.5 (20.0,21.0) 22.0 (21.4,22.7) 23.6 (21.5,25.7) HighSchoolGraduate 21.0 (20.5,21.6) 18.6 (17.5,19.7) 21.0 (20.2,21.8) 21.9 (21.1,22.8) 27.4 (23.8,30.9) CollegeGraduateor Above 22.4 (21.8,22.9) 19.5 (18.6,20.4)* 21.7 (21.0,22.5) 23.6 (22.3,24.9) 32.3 (22.2,42.4)* Occupation AgricultureWorker 21.2 (20.7,21.7) 18.0 (17.2,18.8) 20.3 (19.8,20.8) 22.0 (21.4,22.6) 24.4 (22.9,25.8) MachineOperator 21.1 (20.4,21.7) 19.5 (18.6,20.4) 20.8 (19.9,21.7) 22.3 (21.4,23.2) 23.0 (14.1,32.0)* BusinessorService Employee 20.7 (20.2,21.2) 17.9 (17.1,18.8) 20.8 (20.2,21.4) 22.0 (20.9,23.1) 24.2 (17.9,30.5)* Leadersof Organizations 20.9 (20.0,21.9) 18.9 (18.1,19.6)* 20.6 (19.4,21.8) 21.5 (20.2,22.9) 25.0 (25.0,25.0)* Clerks 22.4 (19.7,25.1) 16.5 (14.8,18.3)* 21.2 (19.6,22.8) 23.7 (19.3,28.2) 22.2 (15.5,28.8)* Specialized Technicians 20.1 (19.5,20.7) 18.2 (17.3,19.1)* 20.3 (19.6,21.1) 21.3 (19.6,23.0) 25.0 (22.8,27.2)* Medical/Health Personnel 24.2 (22.3,26.0)* 0.0 (,)* 21.9 (20.5,23.2)* 25.1 (23.1,27.0)* 0.0 (,)* TeachingStaff 24.6 (22.5,26.7) 0.0 (,)* 23.2 (21.1,25.3)* 27.6 (22.4,32.7)* 0.0 (,)* Soldiers 18.4 (17.8,19.0)* 19.0 (19.0,19.0)* 18.0 (18.0,18.0)* 18.0 (18.0,18.0)* 0.0 (,)* Students 19.6 (18.8,20.4)* 19.6 (18.8,20.4)* 0.0 (,)* 0.0 (,)* 0.0 (,)* NoJobs 21.7 (19.9,23.5) 18.2 (17.6,18.8)* 20.6 (19.0,22.3) 22.0 (20.3,23.7) 26.7 (20.1,33.3) Retired 23.2 (21.8,24.6) 0.0 (,)* 18.0 (18.0,18.0)* 21.8 (20.6,23.0) 25.1 (22.8,27.5) Others 21.8 (19.9,23.6) 17.0 (17.0,17.0)* 21.5 (18.7,24.2)* 23.1 (20.2,26.1)* 22.7 (18.3,27.0)* Region East 21.7 (21.2,22.3) 19.3 (18.2,20.3) 21.2 (20.5,21.8) 22.6 (21.9,23.4) 26.3 (23.9,28.8) Central 21.1 (20.5,21.8) 18.0 (17.4,18.6) 20.5 (19.8,21.1) 21.7 (20.9,22.5) 24.4 (22.2,26.7) West 20.8 (20.4,21.2) 17.8 (17.2,18.4) 20.2 (19.8,20.7) 22.0 (21.4,22.6) 24.2 (22.5,26.0) *Estimatebasedonlessthan25unweightedcases. 154
181 Table4.20:Percentagedistributionofeverdailysmokers2034yearsoldbyageatdailysmoking initiation,andselecteddemographicvariables GATSChina,2010. AgeatDailySmokingInitiation(Years) Total DemographicCharacteristics < % N Percentage(95%CI) Overall 1.8 (1.0,3.3) 10.5 (7.1,15.4) 40.4 (32.1,49.2) 47.3 (38.2,56.6) Gender Male 1.8 (1.0,3.3) 10.6 (7.1,15.4) 40.3 (32.1,49.2) 47.3 (38.1,56.6) Female 0.0 (,)* 0.0 (,)* 55.8 (13.1,91.3)* 44.2 (8.7,86.9)* Residence Urban 3.2 (1.5,6.7) 6.0 (2.7,13.1) 35.3 (22.8,50.3) 55.5 (39.2,70.7) Rural 0.9 (0.3,2.5) 13.6 (8.5,21.0) 43.8 (34.2,53.9) 41.8 (32.7,51.4) Occupation AgricultureWorker 1.2 (0.3,5.0) 11.5 (4.5,26.6) 51.5 (38.7,64.1) 35.8 (25.5,47.7) MachineOperator 1.2 (0.3,4.5) 9.6 (4.6,19.2) 34.5 (22.9,48.4) 54.7 (39.5,69.0) BusinessorServiceEmployee 1.8 (0.4,7.9) 10.2 (4.6,21.1) 36.8 (23.7,52.3) 51.1 (38.2,63.9) Leadersoforganizations 9.2 (2.3,30.4) 1.8 (0.2,12.8) 34.5 (15.7,59.9) 54.4 (33.4,73.9) Clerks 0.0 (,)* 18.8 (3.2,61.6)* 25.9 (6.4,64.1)* 55.3 (18.3,87.2)* SpecializedTechnicians 4.1 (1.4,11.6) 7.0 (2.1,21.3) 26.8 (11.1,51.9) 62.1 (36.7,82.2) Medical/HealthPersonnel 0.0 (,)* 0.0 (,)* 38.5 (7.8,82.2)* 61.5 (17.8,92.2)* TeachingStaff 0.0 (,)* 0.0 (,)* 0.0 (,)* (,)* Soldiers 0.0 (,)* 0.0 (,)* (,)* 0.0 (,)* Students 0.0 (,)* 0.0 (,)* 0.0 (,)* (,)* NoJobs 0.3 (0.0,2.3) 22.5 (12.4,37.2) 47.4 (24.6,71.4) 29.8 (8.8,65.2) Retired 0.0 (,)* 0.0 (,)* 0.0 (,)* 0.0 (,)* Others 0.0 (,)* 0.0 (,)* (,)* 0.0 (,)* Region East 0.9 (0.3,2.6) 6.1 (2.7,12.9) 34.5 (21.1,50.9) 58.6 (39.7,75.2) Central 0.6 (0.1,2.8) 15.6 (8.1,27.9) 43.3 (31.2,56.3) 40.6 (28.0,54.6) West 3.3 (1.6,6.8) 12.6 (6.6,22.7) 44.9 (33.1,57.3) 39.2 (31.6,47.4) *Estimatebasedonlessthan25unweightedcases. 155
182 Table4.21:Averageageofdailysmokinginitiationamongeverdailysmokers2034yearsold,by selecteddemographiccharacteristics GATSChina,2010. Demographic Characteristics AgeatDailySmokingInitiation 1 Overall Male Female Average(95%CI) Overall 19.5 (19.0,19.9) 19.5 (19.0,19.9) 21.2 (18.1,24.2)* Residence Urban 20.0 (19.2,20.8) 20.0 (19.2,20.7) 26.2 (18.5,33.9)* Rural 19.1 (18.6,19.6) 19.1 (18.6,19.6) 19.8 (18.2,21.4)* EducationLevel 2 PrimarySchoolorLess 19.1 (18.2,20.0) 19.1 (18.1,20.1) 19.3 (18.6,20.0)* AttendedSecondarySchool 19.8 (19.0,20.6) 19.8 (19.0,20.6) 0.0 (,)* HighSchoolGraduate 19.7 (18.7,20.8) 19.7 (18.6,20.8) 32.0 (32.0,32.0)* CollegeGraduateorAbove 21.8 (21.0,22.6) 21.8 (21.0,22.6) 22.0 (22.0,22.0)* Occupation AgricultureWorker 19.0 (18.4,19.6) 19.0 (18.4,19.6) 18.0 (18.0,18.0)* MachineOperator 19.8 (19.0,20.6) 19.8 (19.0,20.6) 0.0 (,)* BusinessorServiceEmployee 19.5 (18.8,20.2) 19.5 (18.8,20.2) 32.0 (32.0,32.0)* Leadersoforganizations 20.5 (19.2,21.7) 20.5 (19.2,21.7) 22.0 (22.0,22.0)* Clerks 20.1 (16.7,23.4)* 20.1 (16.7,23.4)* 0.0 (,)* SpecializedTechnicians 19.9 (18.8,21.0) 19.9 (18.8,21.0) 0.0 (,)* Medical/HealthPersonnel 21.1 (18.8,23.5)* 21.1 (18.8,23.5)* 0.0 (,)* TeachingStaff 22.4 (21.7,23.1)* 22.4 (21.7,23.1)* 0.0 (,)* Soldiers 18.5 (17.8,19.2)* 18.5 (17.8,19.2)* 0.0 (,)* Students 20.0 (20.0,20.0)* 20.0 (20.0,20.0)* 0.0 (,)* NoJobs 18.4 (17.2,19.7) 18.4 (17.1,19.7) 19.4 (18.5,20.2)* Retired 0.0 (,)* 0.0 (,)* 0.0 (,)* Others 17.4 (17.4,17.4)* 17.4 (17.4,17.4)* 0.0 (,)* Region East 20.3 (19.4,21.2) 20.3 (19.4,21.1) 25.0 (19.1,31.0)* Central 19.2 (18.5,19.8) 19.2 (18.5,19.8) 18.9 (18.6,19.2)* West 18.8 (18.4,19.2) 18.8 (18.4,19.2) 21.0 (21.0,21.0)* 1 Includesmanufacturedcigaretteandhandrolledcigarette. 2 Educationlevelisreportedonlyamongrespondents25+yearsold. *Estimatebasedonlessthan25unweightedcases. 156
183 Table4.22Currentsmokingprevalenceamongadultsagedbetween15and69yearsin1996,2002and2010 Currentsmoking prevalence 1996(%) Averageannual change Averageannual change Male 63.0(62.7,63.4) 57.4(56.3,58.4) 54.0(51.6,56.3) 0.93% 0.43% Female 3.8(3.6,3.9) 2.6(2.2,2.9) 2.1(1.6,2.8) 0.20% 0.06% Urban 31.8(31.4,32.2) 25.0(23.8,26.1) 27.1(24.8,29.4) 1.13% +0.26% Rural 36.9(36.5,37.3) 33.0(32.1,33.9) 30.0(27.7,32.4) 0.65% 0.38% Total 35.3(35.1,35.6) 31.1(30.4,31.8) 28.7(27.1,30.3) 0.70% 0.30% Total(standardized) 33.7(33.5,34.0) 28.5(27.8,29.2) 27.9(27.1,28.7) 0.87% 0.08% Sources:Dataintable4.22comefromthe1996NationalPrevalenceSurveyofSmokingPattern,the2002BehaviorRiskFactorSurvey,andGATSChina,
184 Table5.1:Percentagedistributionofdailysmokers15yearsold,bytimetofirsttobaccouseupon wakingandselecteddemographiccharacteristics GATSChina,2010. DemographicCharacteristics TimetoFirstSmoke Total 5minutes 630minutes 3160minutes >60minutes % N Percentage(95%CI) Overall 24.3 (21.3,27.7) 26.0 (23.4,28.7) 17.5 (14.8,20.6) 32.2 (28.7,35.8) 100 3,497 Gender Male 24.1 (21.1,27.4) 26.2 (23.5,29.1) 17.8 (15.0,21.0) 31.9 (28.4,35.6) 100 3,300 Female 29.3 (20.2,40.4) 21.0 (13.1,31.9) 10.7 (6.3,17.8) 38.9 (25.6,54.2) Age(years) (9.1,22.1) 17.4 (8.8,31.4) 26.7 (16.4,40.3) 41.4 (29.1,54.9) (18.3,26.2) 27.1 (23.5,31.2) 17.4 (14.0,21.3) 33.5 (28.3,39.1) 100 1, (27.1,35.1) 27.2 (24.5,30.2) 14.7 (11.6,18.6) 27.1 (23.5,31.0) 100 1, (17.3,27.5) 27.8 (22.7,33.5) 16.7 (12.9,21.5) 33.5 (27.4,40.2) Residence Urban 20.5 (16.7,25.0) 27.2 (23.9,30.9) 18.1 (14.5,22.3) 34.1 (29.8,38.8) 100 1,290 Rural 27.1 (22.7,32.0) 25.1 (21.7,28.7) 17.1 (13.3,21.7) 30.7 (25.9,36.0) 100 2,207 EducationLevel 1 PrimarySchoolorLess 32.6 (29.1,36.4) 27.2 (23.8,30.9) 13.7 (11.0,16.8) 26.5 (22.3,31.2) 100 1,247 AttendedSecondarySchool 26.2 (22.1,30.9) 28.6 (24.7,32.9) 16.1 (12.3,20.9) 29.0 (24.9,33.5) 100 1,318 HighSchoolGraduate 19.8 (14.7,26.1) 27.3 (21.8,33.6) 19.2 (14.2,25.4) 33.7 (26.8,41.3) CollegeGraduateorAbove 17.2 (12.6,23.0) 20.9 (14.6,29.0) 17.0 (12.4,22.8) 44.9 (37.6,52.5) Occupation AgricultureWorker 28.9 (23.2,35.4) 28.8 (24.4,33.5) 17.6 (12.6,24.0) 24.8 (19.7,30.6) 100 1,565 MachineOperator 23.1 (17.1,30.5) 31.4 (24.0,39.9) 14.7 (10.0,20.9) 30.8 (22.5,40.5) BusinessorService Employee 20.5 (15.4,26.8) 21.2 (16.9,26.3) 22.1 (15.6,30.4) 36.2 (30.1,42.6) LeadersofOrganizations 22.1 (14.2,32.7) 23.0 (14.1,35.2) 10.0 (5.3,18.0) 44.8 (29.8,60.9) Clerks 19.4 (10.0,34.3) 18.8 (9.8,32.9) 26.1 (13.6,44.4) 35.6 (20.6,54.2) SpecializedTechnicians 15.4 (7.8,28.4) 19.8 (12.7,29.5) 25.0 (15.7,37.4) 39.7 (28.9,51.6) Medical/HealthPersonnel 39.5 (15.0,70.6)* 0.9 (0.1,6.7)* 12.8 (3.6,36.4)* 46.9 (19.5,76.2)* TeachingStaff 13.8 (5.7,29.7) 13.8 (4.7,34.3) 26.4 (9.9,53.9) 46.0 (20.5,73.7) Soldiers 42.1 (5.4,90.2)* 14.2 (1.4,65.4)* 43.7 (5.8,90.7)* 0.0 (,)* Students 0.0 (,)* 0.0 (,)* 10.5 (1.0,58.8)* 89.5 (41.2,99.0)* NoJobs 25.7 (17.2,36.5) 20.2 (12.2,31.7) 13.2 (8.3,20.4) 40.9 (26.2,57.4) Retired 22.4 (17.3,28.5) 27.7 (21.3,35.1) 15.5 (10.0,23.2) 34.5 (28.4,41.1) Others 8.5 (2.5,25.2) 21.4 (5.0,58.7) 28.4 (15.2,46.8) 41.8 (14.5,75.2) Region East 19.3 (15.2,24.4) 26.1 (22.6,30.0) 18.7 (14.9,23.3) 35.8 (30.1,42.0) 100 1,051 Central 33.7 (29.5,38.3) 20.0 (15.2,25.9) 15.3 (12.8,18.2) 30.9 (25.5,37.0) 100 1,055 West 22.3 (16.6,29.3) 30.2 (25.4,35.4) 18.0 (12.6,25.2) 29.5 (23.6,36.1) 100 1,391 1 Educationlevelisreportedonlyamongrespondents25+yearsold. *Estimatebasedonlessthan25unweightedcases. 158
185 Demographic Characteristics Table5.2:Percentagedistributionofeversmokers15yearsold,bycurrentsmokingstatus,quitting status,andselecteddemographiccharacteristics GATSChina,2010. FormerSmokers (SmokersWhoQuit) CurrentSmokers NeverTriedtoQuitBefore Total PlantoQuit 1 DoNotPlantoQuit TriedtoQuitBefore % N Percentage(95%CI) Overall 16.9 (14.7,19.4) 5.1 (3.8,6.9) 44.9 (40.3,49.6) 33.1 (30.2,36.2) 100 4,649 Gender Male 16.5 (14.3,19.0) 5.1 (3.7,6.9) 45.1 (40.4,49.9) 33.3 (30.2,36.5) 100 4,358 Female 24.9 (18.8,32.3) 4.8 (2.4,9.5) 40.2 (31.8,49.3) 30.0 (23.0,38.1) Age(years) (4.1,16.7) 7.9 (2.6,21.4) 52.6 (37.6,67.1) 31.0 (20.5,43.9) (8.2,14.3) 5.1 (3.5,7.5) 49.5 (44.2,54.7) 34.5 (30.8,38.4) 100 1, (16.9,22.1) 4.7 (3.6,6.1) 40.7 (36.2,45.4) 35.3 (31.4,39.4) 100 2, (34.2,44.6) 3.3 (2.1,5.3) 34.1 (28.9,39.7) 23.3 (20.1,26.9) Residence Urban 17.6 (14.3,21.4) 4.5 (2.5,7.8) 46.7 (40.5,53.0) 31.3 (28.0,34.7) 100 1,827 Rural 16.3 (13.7,19.4) 5.6 (4.1,7.6) 43.5 (37.6,49.6) 34.6 (30.2,39.2) 100 2,822 EducationLevel 2 PrimarySchoolorLess 23.6 (20.3,27.3) 4.7 (3.3,6.5) 43.0 (38.6,47.4) 28.8 (25.6,32.1) 100 1,675 AttendedSecondarySchool 14.0 (11.5,16.8) 4.9 (3.7,6.6) 44.7 (40.1,49.4) 36.4 (32.7,40.2) 100 1,663 HighSchoolGraduate 18.4 (13.8,24.1) 3.3 (2.0,5.4) 43.2 (36.1,50.7) 35.1 (30.7,39.7) CollegeGraduateorAbove 17.1 (13.5,21.6) 7.2 (3.4,14.7) 44.4 (38.4,50.5) 31.3 (25.9,37.2) Occupation AgricultureWorker 15.4 (12.2,19.1) 3.9 (2.9,5.3) 47.2 (39.2,55.3) 33.5 (28.2,39.4) 100 1,969 MachineOperator 8.5 (5.7,12.5) 6.6 (3.9,11.0) 50.3 (40.4,60.2) 34.6 (27.4,42.6) BusinessorServiceEmployee 11.1 (8.0,15.1) 7.8 (4.0,14.8) 46.3 (40.5,52.2) 34.9 (29.2,41.0) LeadersofOrganizations 13.9 (7.1,25.4) 2.1 (0.8,5.6) 46.9 (36.9,57.1) 37.1 (28.8,46.2) Clerks 6.8 (3.1,14.4) 18.9 (5.8,46.8) 38.7 (24.2,55.6) 35.6 (22.2,51.6) SpecializedTechnicians 14.8 (8.8,23.9) 5.6 (2.9,10.5) 49.0 (41.0,57.2) 30.6 (23.1,39.3) Medical/HealthPersonnel 20.9 (9.6,39.8) 13.9 (5.4,31.3) 29.1 (11.0,57.6) 36.1 (19.8,56.4) TeachingStaff 24.7 (11.4,45.6) 1.9 (0.2,13.6) 41.8 (23.5,62.7) 31.6 (17.7,49.8) Soldiers 0.0 (,)* 2.6 (0.3,21.5)* 83.6 (35.9,97.9)* 13.8 (1.4,64.2)* Students 73.2 (38.1,92.4)* 0.0 (,)* 16.3 (3.7,49.4)* 10.5 (2.2,38.4)* NoJobs 28.2 (21.9,35.6) 1.8 (0.8,3.9) 41.5 (33.1,50.4) 28.5 (21.9,36.2) Retired 40.3 (34.1,46.7) 3.2 (1.6,6.5) 26.8 (22.1,32.1) 29.7 (23.9,36.3) Others 21.4 (7.0,49.7) 0.5 (0.1,3.7) 46.8 (21.3,74.0) 31.3 (16.4,51.3) Region East 18.7 (14.4,23.9) 5.1 (3.2,8.0) 45.5 (37.8,53.5) 30.7 (26.3,35.5) 100 1,413 Central 18.6 (15.1,22.7) 4.5 (3.3,6.1) 41.3 (35.3,47.6) 35.5 (31.6,39.7) 100 1,471 West 13.6 (10.2,18.0) 5.5 (3.0,10.0) 47.1 (37.7,56.6) 33.8 (28.1,40.0) 100 1,765 1 Planorthinkaboutquittingwithinthenext12months. 2 Educationlevelisreportedonlyamongrespondents25+yearsold. *Estimatebasedonlessthan25unweightedcases. 159
186 Table5.3:Percentageofalladultsandeverdailysmokers15yearsoldwhoareformerdailysmokers, byselecteddemographiccharacteristics GATSChina,2010. Demographic Characteristics FormerDailySmokers 1 (AmongAllAdults) FormerDailySmokers 1 (Among EverDailySmokers) 2 Percentage(95%CI) N Percentage(95%CI) N Overall 3.7 (3.2,4.4) 13, (11.0,14.8) 4,306 Gender Male 6.9 (5.9,8.0) 6, (10.8,14.6) 4,048 Female 0.4 (0.3,0.7) 6, (11.1,24.5) 258 Age(years) (0.1,1.0) 1, (0.9,6.4) (1.4,2.7) 5, (4.7,9.2) 1, (5.1,7.2) 5, (13.7,18.7) 1, (9.1,13.7) 2, (29.2,39.9) 797 Residence Urban 3.7 (2.9,4.8) 5, (10.9,17.3) 1,639 Rural 3.7 (3.1,4.4) 7, (10.0,14.4) 2,667 EducationLevel 3 PrimarySchoolorLess 5.4 (4.4,6.6) 4, (15.6,23.1) 1,601 AttendedSecondarySchool 4.2 (3.3,5.3) 4, (9.1,14.1) 1,569 HighSchoolGraduate 4.9 (3.5,6.7) 1, (9.6,18.0) 659 CollegeGraduateorAbove 3.2 (2.2,4.7) 1, (9.0,17.4) 327 Occupation AgricultureWorker 3.6 (2.8,4.6) 5, (8.6,14.6) 1,873 MachineOperator 3.4 (2.1,5.5) 1, (4.3,11.0) 614 BusinessorServiceEmployee 2.2 (1.4,3.2) 1, (5.2,11.4) 507 Leadersoforganizations 4.4 (1.9,9.7) (5.3,25.0) 241 Clerks 0.9 (0.3,2.9) (0.9,9.1) 78 SpecializedTechnicians 3.3 (1.8,5.9) (4.9,15.8) 180 Medical/HealthPersonnel 2.0 (0.6,6.6) (3.3,32.2) 30 TeachingStaff 3.6 (1.4,8.9) (9.2,45.4) 39 Soldiers 0.0 (,)* (,)* 3 Students 0.3 (0.0,2.5) (5.0,84.0)* 6 NoJobs 3.4 (2.2,5.1) 1, (15.0,27.7) 264 Retired 10.0 (8.1,12.3) 1, (30.4,43.3) 424 Others 9.0 (2.9,24.4) (7.2,50.2) 44 Region East 3.8 (2.8,5.0) 4, (10.7,18.1) 1,304 Central 4.6 (3.6,6.0) 3, (12.2,19.4) 1,350 West 2.9 (2.1,4.0) 5, (6.9,12.9) 1,652 1 Currentnonsmoker. 2 Alsoknownasthequitratiofordailysmoking. 3 Educationlevelisreportedonlyamongrespondents25+yearsold. *Estimatebasedonlessthan25unweightedcases. 160
187 Demographic Characteristics Table5.4:Percentageofsmokers15yearsoldwhomadeaquitattempt,andwhoreceivedhealthcare provideradviceinthepast12months,byselecteddemographiccharacteristics GATSChina,2010. MadeQuitAttempt 1 SmokingCessationandHealthCareSeekingBehavior VisitedaHCP 1,2 AskedbyHCPIfa Smoker 2,3 Percentage(95%C.I) AdvisedtoQuitbyHCP AmongThoseWhoMade AdvisedtoQuitbyHCP 2,3 aquitattempt 2,3 Overall 36.4(32.1,40.9) 30.0 (26.7,33.5) 40.8 (35.3,46.5) 33.9 (29.1,39.0) 43.4 (35.7,51.4) Gender Male 35.9(31.6,40.5) 29.5 (26.2,33.1) 41.7 (36.1,47.6) 34.5 (29.6,39.8) 46.9 (38.5,55.4) Female 46.4(35.3,58.0) 40.3 (30.9,50.6) 25.5 (18.2,34.5) 23.1 (15.0,34.0) 5.9 (1.9,17.1) Age(years) (51.0,82.5) 20.5 (13.7,29.4) 22.8 (12.2,38.6) 17.7 (8.4,33.6) 28.8 (7.5,66.7)* (25.8,37.5) 25.8 (22.0,30.0) 34.2 (26.6,42.6) 26.6 (21.1,32.9) 37.5 (26.4,50.1) (25.3,34.5) 32.3 (28.0,36.9) 45.9 (39.6,52.4) 38.7 (32.4,45.5) 51.0 (38.7,63.2) (35.0,54.1) 58.6 (51.7,65.2) 54.7 (45.9,63.2) 48.9 (39.3,58.6) 47.7 (32.2,63.7) Residence Urban 31.1(26.2,36.4) 28.0 (24.0,32.4) 39.4 (33.4,45.8) 31.1 (26.2,36.6) 35.3 (26.9,44.7) Rural 40.0(34.3,45.9) 31.5 (27.1,36.2) 41.7 (33.8,50.1) 35.7 (28.7,43.3) 48.6 (38.1,59.4) EducationLevel 4 PrimarySchoolorLess 35.3(29.2,42.0) 43.2 (38.2,48.4) 46.5 (39.1,54.2) 40.0 (32.4,48.0) 40.5 (29.9,52.1) AttendedSecondarySchool 30.5(26.3,34.9) 28.4 (24.5,32.6) 41.5 (33.7,49.8) 33.4 (27.0,40.5) 49.0 (34.1,64.0) HighSchoolGraduate 29.1(21.8,37.7) 26.4 (20.8,32.8) 41.5 (31.4,52.3) 34.8 (25.4,45.6) 46.3 (26.4,67.4) CollegeGraduateorAbove 34.8(25.4,45.6) 24.5 (19.2,30.8) 32.2 (19.8,47.7) 26.5 (17.0,38.7) 47.3 (26.9,68.7) Occupation AgricultureWorker 37.7(32.2,43.4) 33.0 (27.1,39.5) 41.8 (31.2,53.1) 35.4 (26.9,44.9) 45.2 (32.5,58.6) MachineOperator 35.9(25.3,48.1) 23.5 (18.7,29.0) 40.4 (30.1,51.6) 32.7 (22.4,44.9) 45.4 (21.1,72.1) BusinessorServiceEmployee 36.6(28.1,46.0) 33.0 (26.4,40.4) 34.9 (25.1,46.2) 25.2 (18.2,33.8) 48.8 (27.5,70.5) LeadersofOrganizations 29.8(19.4,42.7) 23.1 (15.6,32.7) 31.9 (21.3,44.7) 30.4 (20.1,43.1) 39.9 (22.4,60.6)* Clerks 43.1(20.3,69.1) 30.7 (16.1,50.5) 52.3 (22.2,80.8)* 50.8 (20.9,80.2)* 79.5 (30.1,97.2)* SpecializedTechnicians 19.9(10.8,33.7) 17.9 (10.7,28.5) 39.7 (17.5,67.2) 23.6 (8.0,52.5) 16.1 (4.6,43.5)* Medical/HealthPersonnel 36.0(12.0,69.8)* 8.0 (1.9,28.4) 0.0 (,)* 0.0 (,)* 0.0 (,)* TeachingStaff 43.7(18.2,73.0)* 36.3 (22.7,52.5) 39.6 (14.6,71.5)* 39.5 (14.6,71.5)* 50.3 (11.4,88.9)* Soldiers 100.0(,)* 13.8 (1.4,64.2)* (,)* (,)* (,)* Students 84.8(43.8,97.6)* 46.8 (11.7,85.4)* 10.4 (1.1,54.6)* 10.4 (1.1,54.6)* 0.3 (0.0,4.7)* NoJobs 43.9(30.0,58.9) 25.3 (17.9,34.5) 38.4 (24.3,54.7) 35.2 (21.7,51.5) 34.4 (13.5,63.8)* Retired 29.1(19.7,40.7) 46.4 (31.6,61.9) 58.1 (48.8,66.8) 50.0 (37.5,62.5) 42.3 (23.5,63.7) Others 44.3(19.7,72.0)* 46.4 (28.5,65.2) 25.2 (8.6,54.8)* 24.1 (7.9,53.8)* 26.4 (9.2,55.9)* Region East 37.6(28.7,47.4) 28.5 (23.9,33.6) 45.1 (37.4,53.1) 36.3 (29.4,43.8) 57.9 (41.7,72.6) Central 37.3(32.4,42.3) 28.5 (24.8,32.4) 37.0 (29.2,45.6) 31.7 (24.7,39.7) 34.8 (25.1,46.0) West 34.4(28.0,41.5) 32.7 (25.7,40.6) 39.5 (29.1,50.9) 33.2 (24.2,43.6) 38.6 (26.9,51.7) 1 Amongcurrentsmokersandformersmokerswhohavebeenabstinentforlessthan12months. 2 HCP=healthcareprovider. 3 Amongcurrentsmokersandformersmokerswhohavebeenabstinentforlessthan12months,andwhovisitedaHCPduringthepast12months. 4 Educationlevelisreportedonlyamongrespondents25+yearsold. *Estimatebasedonlessthan25unweightedcases. 161
188 Table5.5:Percentageofsmokers 1 15yearsoldwhoattemptedtoquitsmokinginthepast12months, bycessationmethodsusedandselecteddemographiccharacteristics GATSChina,2010. Demographic Characteristics CessationMethodsUsed Pharmacotherapy 2 Counseling/Advice 3 DidNotUseAnyMethod Percentage(95%CI) Overall 3.1 (1.8,5.4) 3.0 (1.5,5.9) 91.8 (88.0,94.4) Gender Male 3.0 (1.7,5.3) 2.9 (1.5,5.7) 91.8 (87.9,94.5) Female 5.4 (1.4,19.1) 4.7 (1.1,18.0) 91.1 (77.5,96.8) Age(years) (1.2,13.7) 2.4 (0.3,14.5) 95.8 (86.3,98.8) (1.3,7.7) 4.3 (1.8,10.0) 87.6 (81.1,92.1) (1.5,6.3) 2.3 (0.8,6.2) 92.2 (87.7,95.1) (0.1,4.4) 2.4 (0.8,7.0) 95.3 (88.9,98.1) Residence Urban 2.7 (1.0,6.7) 0.8 (0.2,3.5) 91.3 (84.8,95.2) Rural 3.4 (1.7,6.9) 4.2 (1.9,9.1) 92.0 (86.7,95.3) EducationLevel 5 PrimarySchoolorLess 0.5 (0.1,3.2) 2.0 (0.4,9.5) 95.6 (89.9,98.1) AttendedSecondarySchool 4.6 (2.1,9.7) 5.1 (2.4,10.4) 87.2 (79.9,92.1) HighSchoolGraduate 2.1 (0.6,6.9) 1.5 (0.3,7.4) 94.2 (87.5,97.4) CollegeGraduateorAbove 3.9 (0.9,15.2) 2.6 (0.4,16.3) 82.5 (62.7,93.0) Occupation AgricultureWorker 2.9 (1.2,7.2) 3.1 (0.9,10.4) 92.5 (85.2,96.4) MachineOperator 2.6 (0.9,7.2) 4.7 (1.4,15.2) 91.6 (81.9,96.3) BusinessorServiceEmployee 3.5 (1.0,11.0) 1.6 (0.4,6.4) 91.8 (82.8,96.3) Leadersoforganizations 3.0 (0.5,17.7) 3.6 (0.5,20.6) 84.8 (67.9,93.6) Clerks 7.4 (0.8,43.7)* 0.0 (,)* 88.4 (55.4,97.9)* SpecializedTechnicians 1.4 (0.2,10.3)* 0.0 (,)* 98.6 (89.7,99.8)* Medical/HealthPersonnel 7.0 (0.9,39.4)* 0.0 (,)* 93.0 (60.6,99.1)* TeachingStaff 5.0 (0.6,31.9)* 0.0 (,)* 95.0 (68.1,99.4)* Soldiers 0.0 (,)* 0.0 (,)* (,)* Students 0.0 (,)* 0.0 (,)* (,)* NoJobs 7.3 (1.0,38.3) 7.5 (1.0,38.0) 86.1 (57.8,96.5) Retired 0.7 (0.1,4.9) 1.1 (0.1,8.1) 93.5 (82.6,97.8) Others 0.0 (,)* 0.0 (,)* 94.2 (62.7,99.4)* Region East 3.0 (1.3,6.9) 2.1 (0.5,8.2) 92.3 (84.4,96.4) Central 3.1 (1.1,8.0) 4.1 (1.4,11.5) 89.6 (82.0,94.2) West 3.3 (1.2,8.8) 3.0 (1.0,8.6) 93.2 (88.0,96.2) 1 Amongcurrentsmokerswhomadeaquitattemptinthepast12monthsandformersmokerswhohavebeenabstinentforless than12months. 2 Pharmacotherapyincludesnicotinereplacementtherapyandprescriptionmedications. 3 Includescounselingatacessationclinicandatelephonequitline/helpline. 5 Educationlevelisreportedonlyamongrespondents25+yearsold. *Estimatebasedonlessthan25unweightedcases. 162
189 Table5.6:Percentageandnumberofeversmokers15yearsoldwhoquitsmoking2yearsagoormore, bygenderandselecteddemographiccharacteristics GATSChina,2010. Demographic Characteristics EverSmokersWhoQuitSmoking>=2 YearsAgo Percentage(95%CI) N Overall 11.7 (10.2,13.3) 4,862 Gender Male 11.5 (10.0,13.2) 4,554 Female 15.1 (11.2,20.2) 308 Age(years) (0.1,1.8) (5.0,9.6) 1, (13.0,17.2) 2, (26.4,36.8) 885 Residence Urban 12.8 (10.5,15.4) 1,898 Rural 10.8 (9.0,13.0) 2,964 EducationLevel 1 PrimarySchoolorLess 17.4 (14.5,20.8) 1,754 AttendedSecondarySchool 10.5 (8.5,13.0) 1,739 HighSchoolGraduate 14.2 (10.7,18.5) 770 CollegeGraduateorAbove 10.4 (7.4,14.5) 401 Occupation AgricultureWorker 11.0 (8.5,14.1) 2,072 MachineOperator 5.2 (3.7,7.3) 690 BusinessorServiceEmployee 8.1 (5.4,12.2) 585 LeadersofOrganizations 7.6 (4.3,13.1) 277 Clerks 4.3 (1.7,10.7) 91 SpecializedTechnicians 10.3 (5.7,18.0) 218 Medical/HealthPersonnel 20.9 (9.6,39.8) 36 TeachingStaff 19.6 (8.5,39.0) 50 Soldiers 0.0 (,)* 4 Students 4.9 (0.6,31.8)* 13 NoJobs 18.2 (13.3,24.3) 300 Retired 33.3 (28.0,39.1) 474 Others 8.9 (2.6,26.6) 49 Region East 12.8 (10.2,16.0) 1,483 Central 13.3 (10.7,16.5) 1,525 West 9.1 (6.8,12.2) 1,854 1 Educationlevelisreportedonlyamongrespondents25+yearsold. *Estimatebasedonlessthan25unweightedcases. 163
190 Table5.7:Weightednumberofeversmokers15yearsold,byquittingstatusandselected demographiccharacteristics GATSChina,2010. Demographic Characteristics FormerSmokers (SmokersWhoQuit) CurrentSmokers NeverTriedtoQuitBefore PlantoQuit 1 DoNotPlantoQuit TriedtoQuitBefore WeightedNumbersinThousands Overall 57,458 17, , ,836 Gender Male 53,668 16, , ,282 Female 3, ,112 4,555 Age(years) ,423 3,157 21,129 12, ,821 6,992 67,301 46, ,537 5,941 51,639 44, ,678 1,251 12,733 8,728 Residence Urban 26,084 6,655 69,333 46,403 Rural 31,374 10,686 83,468 66,433 EducationLevel 2 PrimarySchoolorLess 20,034 3,953 36,486 24,412 AttendedSecondarySchool 16,850 5,973 53,974 43,917 HighSchoolGraduate 11,976 2,124 28,072 22,773 CollegeGraduateorAbove 5,081 2,135 13,140 9,272 Occupation AgricultureWorker 17,832 4,523 54,776 38,929 MachineOperator 5,111 3,964 30,248 20,811 BusinessorServiceEmployee 5,847 4,120 24,431 18,410 LeadersofOrganizations 2, ,923 7,851 Clerks 466 1,289 2,635 2,422 SpecializedTechnicians 2, ,793 5,485 Medical/HealthPersonnel ,094 1,358 TeachingStaff , Soldiers Students 1, NoJobs 6, ,085 6,243 Retired 12, ,322 9,218 Others , Region East 23,197 6,327 56,428 38,005 Central 17,912 4,378 39,854 34,252 West 16,348 6,636 56,519 40,579 1 Planorthinkaboutquittingwithinthenext12months. 2 Educationlevelisreportedonlyamongrespondents25+yearsold. *Estimatebasedonlessthan25unweightedcases. 164
191 Demographic Characteristics Table5.8:Percentagedistributionofcurrentsmokers15yearsoldbyinterestinquittingsmokingand selecteddemographiccharacteristics GATSChina,2010. PlanningtoQuit WithinNextMonth ThinkingAboutQuitting WithinNext12Months InterestinQuittingSmoking 1 WillQuitSomeday,But NotintheNext12 Months NotInterestedin Quitting Don tknow Percentage(95%CI) Overall 5.8 (4.3,7.7) 10.3 (8.1,13.0) 25.1 (21.0,29.7) 49.2 (45.0,53.3) 9.6 (7.0,13.0) 100 Gender Male 5.6 (4.1,7.6) 10.4 (8.2,13.1) 25.6 (21.3,30.5) 49.1 (44.8,53.4) 9.3 (6.8,12.8) 100 Female 10.6 (5.9,18.5) 8.9 (4.8,16.0) 14.2 (9.8,20.1) 51.2 (42.2,60.0) 15.1 (7.1,29.1) 100 Age(years) (1.9,12.0) 12.6 (5.7,25.6) 28.0 (19.0,39.2) 39.3 (29.9,49.5) 15.2 (8.8,25.1) (3.3,7.9) 9.3 (7.0,12.2) 28.3 (22.9,34.5) 46.6 (41.3,51.9) 10.7 (8.2,14.0) (4.5,7.5) 11.7 (8.8,15.3) 22.7 (19.1,26.8) 54.0 (49.3,58.7) 5.7 (4.0,8.1) (6.2,18.0) 6.2 (4.2,8.9) 13.6 (9.6,18.8) 59.0 (52.4,65.3) 10.5 (6.9,15.6) 100 Residence Urban 3.8 (2.9,5.1) 9.7 (6.8,13.7) 27.9 (20.7,36.5) 50.6 (43.6,57.6) 7.9 (5.8,10.7) 100 Rural 7.3 (5.0,10.4) 10.8 (8.1,14.2) 23.1 (19.3,27.3) 48.1 (43.0,53.2) 10.8 (7.1,16.3) 100 EducationLevel 2 PrimarySchoolorLess 7.3 (5.2,10.2) 7.8 (5.7,10.5) 18.7 (15.6,22.3) 57.2 (52.6,61.6) 9.1 (6.2,13.0) 100 AttendedSecondary School 6.4 (4.3,9.5) 11.1 (8.1,15.0) 26.3 (21.7,31.3) 46.6 (41.1,52.2) 9.6 (7.2,12.7) 100 HighSchoolGraduate 4.7 (2.8,7.7) 8.1 (5.5,11.8) 31.1 (24.1,39.2) 49.6 (42.5,56.7) 6.6 (3.8,11.2) 100 CollegeGraduateorAbove 2.7 (1.1,6.5) 14.8 (9.5,22.4) 20.2 (14.7,27.2) 53.8 (43.9,63.4) 8.4 (4.8,14.4) 100 Occupation AgricultureWorker 5.6 (3.3,9.2) 7.8 (5.8,10.4) 25.0 (21.4,29.0) 51.8 (47.3,56.3) 9.8 (6.5,14.5) 100 MachineOperator 5.5 (2.4,12.2) 12.1 (7.4,19.1) 31.4 (21.0,44.1) 42.1 (33.5,51.3) 8.8 (4.8,15.5) 100 BusinessorService Employee 5.3 (3.4,8.1) 11.1 (6.8,17.7) 20.6 (16.7,25.0) 53.9 (46.4,61.2) 9.2 (6.0,13.7) 100 Leadersoforganizations 2.9 (1.1,7.2) 9.7 (4.3,20.5) 22.1 (13.8,33.4) 52.3 (41.1,63.3) 12.9 (7.3,21.9) 100 Clerks 2.6 (0.6,10.1) 29.7 (13.4,53.6) 16.3 (8.7,28.5) 43.4 (26.7,61.8) 7.9 (3.1,18.7) 100 SpecializedTechnicians 6.2 (2.4,15.0) 6.5 (3.6,11.6) 31.5 (18.9,47.5) 45.4 (33.3,58.0) 10.4 (4.3,23.0) 100 Medical/HealthPersonnel 21.5 (6.5,51.9) 17.6 (6.9,38.1) 20.2 (5.8,51.0) 28.5 (9.1,61.3) 12.3 (3.5,35.3) 100 TeachingStaff 2.4 (0.3,16.1) 10.9 (3.0,32.3) 14.5 (5.6,32.7) 66.9 (44.9,83.4) 5.3 (0.7,30.4) 100 Soldiers 0.0 (,)* 2.6 (0.3,21.5)* 41.0 (5.4,89.4)* 56.4 (10.1,93.7)* 0.0 (,)* 100 Students 0.0 (,)* 0.0 (,)* 13.1 (1.6,58.6)* 65.8 (25.7,91.5)* 21.0 (3.6,65.5)* 100 NoJobs 8.2 (3.9,16.2) 11.9 (6.7,20.2) 25.1 (13.9,41.0) 46.6 (32.3,61.4) 8.2 (3.9,16.6) 100 Retired 8.9 (4.5,16.8) 12.9 (8.7,18.8) 18.9 (11.9,28.7) 51.8 (44.2,59.2) 7.5 (4.0,13.9) 100 Others 5.9 (1.9,16.9) 0.0 (,) 41.4 (25.5,59.3) 25.9 (12.5,46.1) 26.9 (9.8,55.3) 100 Region East 3.6 (2.5,5.2) 11.0 (7.3,16.1) 26.2 (17.2,37.8) 48.3 (40.3,56.4) 10.9 (5.9,19.4) 100 Central 7.0 (4.7,10.1) 8.8 (6.6,11.6) 22.9 (17.8,29.0) 51.6 (45.9,57.3) 9.7 (6.2,14.9) 100 West 7.1 (4.0,12.1) 10.8 (7.0,16.5) 25.7 (22.0,29.9) 48.2 (41.8,54.7) 8.1 (5.2,12.5) Amongcurrentdailyorlessthandailysmokers. 2 Educationlevelisreportedonlyamongrespondents25+yearsold. *Estimatebasedonlessthan25unweightedcases. Total 165
192 Demographic Characteristics Table6.1:Percentageofadults15yearsoldwhoareexposedtosecondhandsmokinginatypicalweek, bysmokingstatusandselecteddemographiccharacteristics GATSChina,2010. Almost Everyday AdultsExposedtoSecondhandSmokinginaTypicalWeek 1 Over3Days PerWeek Exposed 1to3Days Not Total PerWeek Overall Exposed % N Percentage(95%CI) NonSmoker 38.0 (34.8,41.3) 6.1 (5.1,7.4) 28.3 (25.4,31.4) 72.4 (69.2,75.5) 27.6 (24.5,30.8) 100 9,065 Gender Male 32.8 (28.5,37.3) 5.9 (4.8,7.3) 35.4 (31.5,39.4) 74.1 (69.6,78.1) 25.9 (21.9,30.4) 100 2,760 Female 40.7 (37.6,43.8) 6.2 (4.9,7.9) 24.7 (22.0,27.7) 71.6 (68.5,74.6) 28.4 (25.4,31.5) 100 6,305 Age(years) (28.8,40.4) 6.0 (4.3,8.3) 31.8 (27.1,36.9) 72.2 (65.6,77.9) 27.8 (22.1,34.4) (37.6,46.5) 7.8 (5.8,10.5) 27.9 (24.2,32.0) 77.7 (74.7,80.5) 22.3 (19.5,25.3) 100 3, (37.9,44.0) 5.0 (4.0,6.2) 26.3 (23.4,29.4) 72.1 (68.3,75.7) 27.9 (24.3,31.7) 100 3, (21.2,28.8) 3.1 (2.0,4.7) 26.6 (22.9,30.6) 54.5 (50.1,58.7) 45.5 (41.3,49.9) 100 1,534 Residence Urban 36.9 (33.4,40.6) 5.1 (3.9,6.7) 28.4 (25.6,31.4) 70.5 (67.0,73.7) 29.5 (26.3,33.0) 100 4,195 Rural 39.0 (34.0,44.3) 7.0 (5.6,8.8) 28.2 (23.9,32.9) 74.2 (68.8,79.0) 25.8 (21.0,31.2) 100 4,870 EducationLevel 2 PrimarySchoolorLess 40.2 (36.3,44.3) 4.8 (3.5,6.5) 24.2 (21.1,27.7) 69.3 (64.8,73.4) 30.7 (26.6,35.2) 100 3,408 AttendedSecondary School 41.7 (38.2,45.4) 5.4 (4.2,7.0) 27.4 (24.2,30.8) 74.5 (71.1,77.7) 25.5 (22.3,28.9) 100 2,561 HighSchoolGraduate 36.9 (31.5,42.7) 7.7 (5.3,11.0) 28.4 (22.8,34.9) 73.1 (68.5,77.2) 26.9 (22.8,31.5) 100 1,246 CollegeGraduateor Above 32.9 (25.2,41.8) 10.1 (7.3,13.9) 32.9 (28.6,37.5) 76.0 (70.1,81.0) 24.0 (19.0,29.9) Occupation AgricultureWorker 43.1 (36.6,49.8) 5.6 (4.1,7.6) 26.0 (22.4,29.9) 74.7 (67.0,81.0) 25.3 (19.0,33.0) 100 3,453 MachineOperator 36.3 (28.5,45.0) 8.8 (5.1,14.9) 31.9 (24.7,40.2) 77.1 (67.6,84.4) 22.9 (15.6,32.4) BusinessorService Employee 48.6 (42.9,54.3) 7.0 (4.7,10.3) 27.5 (22.9,32.7) 83.1 (78.9,86.6) 16.9 (13.4,21.1) 100 1,155 LeadersofOrganizations 39.7 (30.3,50.0) 11.7 (7.2,18.4) 34.4 (25.8,44.1) 85.8 (79.8,90.2) 14.2 (9.8,20.2) Clerks 38.1 (26.9,50.7) 13.6 (6.9,24.9) 30.5 (19.2,44.7) 82.2 (72.5,89.0) 17.8 (11.0,27.5) SpecializedTechnicians 32.7 (24.3,42.3) 8.3 (5.0,13.6) 38.2 (29.8,47.3) 79.2 (69.9,86.2) 20.8 (13.8,30.1) Medical/Health Personnel 39.4 (25.8,54.8) 4.3 (1.4,12.6) 33.4 (20.5,49.4) 77.1 (66.6,85.1) 22.9 (14.9,33.4) TeachingStaff 23.2 (16.5,31.5) 8.2 (4.0,15.8) 39.6 (29.9,50.2) 70.9 (61.9,78.5) 29.1 (21.5,38.1) Soldiers 31.4 (4.3,82.4)* 0.0 (,)* 36.1 (7.1,80.7)* 67.5 (17.0,95.5)* 32.5 (4.5,83.0)* Students 22.6 (15.9,31.1) 5.5 (2.9,9.9) 37.2 (30.9,43.9) 65.2 (56.1,73.4) 34.8 (26.6,43.9) NoJobs 39.2 (34.5,44.1) 5.6 (3.8,8.3) 20.0 (15.2,25.9) 64.8 (60.7,68.8) 35.2 (31.2,39.3) 100 1,103 Retired 25.2 (21.5,29.4) 1.8 (1.1,2.8) 26.9 (22.5,31.6) 53.9 (48.7,58.9) 46.1 (41.1,51.3) 100 1,161 Others 30.9 (20.4,43.8) 2.0 (0.4,9.3) 39.0 (27.7,51.5) 71.9 (60.1,81.3) 28.1 (18.7,39.9) Region East 31.3 (27.0,35.9) 4.9 (3.6,6.6) 32.1 (26.8,37.9) 68.3 (63.9,72.3) 31.7 (27.7,36.1) 100 3,125 Central 40.5 (36.4,44.7) 7.3 (5.7,9.3) 27.5 (23.2,32.3) 75.3 (70.2,79.7) 24.7 (20.3,29.8) 100 2,617 West 44.2 (36.8,51.9) 6.6 (4.6,9.4) 24.3 (20.5,28.6) 75.2 (67.7,81.4) 24.8 (18.6,32.3) 100 3,323 1 Don tknow,refusedexcluded. 2 Educationlevelisreportedonlyamongrespondents25+yearsold. *Estimatebasedonlessthan25unweightedcases. 166
193 Table6.2:Percentageandnumberofadults15yearsoldwhoreportsmokingoccurredinsidetheir home,bysmokingstatusandselecteddemographiccharacteristics GATSChina,2010. Demographic Characteristics Adultsreportingthatsmokinginsidetheirhome 1 Overall Percentage(95%CI) WeightedNumber inthousands Nonsmokers Percentage(95%CI) WeightedNumber inthousands Overall 67.3(64.1,70.2) 716, (54.6,61.8) 445,916 Gender Male 70.5(67.0,73.9) 383, (43.3,53.6) 123,834 Female 63.9(60.6,67.0) 333, (59.9,66.4) 322,082 Age(years) (63.7,74.8) 159, (58.1,70.1) 120, (64.2,69.9) 282, (54.6,61.6) 168, (64.8,71.6) 212, (51.8,61.2) 116, (55.0,64.3) 62, (44.1,54.5) 39,778 Residence Urban 60.0(56.4,63.5) 294, (46.4,54.3) 181,849 Rural 73.4(68.5,77.8) 422, (59.5,70.8) 264,068 EducationLevel 2 PrimarySchoolorLess 68.9(64.7,72.7) 191, (56.3,65.3) 127,747 AttendedSecondarySchool 71.5(68.2,74.7) 217, (55.9,64.4) 117,139 HighSchoolGraduate 62.5(58.9,66.0) 98, (44.3,54.9) 50,538 CollegeGraduateorAbove 51.7(46.3,57.0) 50, (36.7,47.5) 29,805 Occupation AgricultureWorker 75.5(69.1,80.9) 254, (59.0,73.8) 156,476 MachineOperator 71.2(66.4,75.6) 82, (47.6,58.8) 30,133 BusinessorServiceEmployee 68.0(63.2,72.4) 113, (55.6,64.7) 70,633 LeadersofOrganizations 59.9(52.8,66.5) 33, (40.6,56.7) 17,242 Clerks 60.1(51.6,68.1) 11, (36.3,60.1) 5,795 SpecializedTechnicians 59.2(50.9,67.0) 25, (34.2,50.4) 10,939 Medical/HealthPersonnel 53.9(43.9,63.7) 9, (36.9,57.7) 7,017 TeachingStaff 48.7(40.7,56.8) 7, (35.4,53.4) 6,086 Soldiers 46.7(14.1,82.4)* (,)* 0 Students 64.4(58.2,70.1) 43, (58.0,69.9) 43,089 NoJobs 63.6(58.9,68.2) 73, (52.7,63.2) 57,678 Retired 55.6(50.5,60.5) 57, (41.5,53.0) 39,550 Others 55.1(39.9,69.5) 3, (15.1,56.5) 1,139 Region East 61.9(57.9,65.7) 255, (49.1,56.9) 161,491 Central 70.2(63.8,75.9) 204, (55.0,69.6) 130,996 West 71.0(64.3,76.9) 256, (52.9,68.7) 153,429 1 Adultsreportingthatsmokinginsidetheirhomeoccursdaily,weekly,ormonthly. 2 Educationlevelisreportedonlyamongrespondents25+yearsold. *Estimatebasedonlessthan25unweightedcases. 167
194 Table6.3:Percentageandnumberofadults15yearsoldwhoworkindoorsnoticedsmokingoccurred atworkplaces,bysmokingstatusandselecteddemographiccharacteristics GATSChina,2010. Demographic Characteristics AdultsWereAwareofTobaccoSmokeatWorkplaces 1 Overall Percentage(95%CI) WeightedNumber inthousands Nonsmokers Percentage(95%CI) WeightedNumber inthousands Overall 63.3(59.2,67.2) 245, (49.9,59.7) 151,045 Gender Male 71.1(66.3,75.4) 156, (51.2,63.5) 62,945 Female 53.2(47.7,58.6) 89, (47.4,58.8) 88,100 Age(years) (44.4,55.9) 56, (38.1,51.2) 42, (62.1,70.8) 129, (53.1,64.4) 79, (69.2,80.2) 58, (57.7,73.9) 29, (23.0,64.1) 1, (10.9,51.4) 632 Residence Urban 62.4(57.0,67.6) 158, (47.0,59.4) 94,995 Rural 65.0(60.2,69.6) 87, (51.9,63.6) 56,049 EducationLevel 2 PrimarySchoolorLess 72.3(61.2,81.2) 19, (51.0,77.9) 12,544 AttendedSecondarySchool 72.2(66.8,77.1) 65, (57.5,70.3) 33,943 HighSchoolGraduate 68.0(62.6,73.0) 53, (50.1,66.2) 28,780 CollegeGraduateorAbove 64.4(57.8,70.4) 51, (48.2,64.7) 33,687 Occupation AgricultureWorker 78.5(66.6,86.9) 14, (56.5,85.0) 8,929 MachineOperator 61.6(52.0,70.5) 44, (35.4,53.6) 17,085 BusinessorServiceEmployee 71.8(65.8,77.1) 81, (60.3,73.7) 55,522 LeadersofOrganizations 73.2(67.3,78.3) 34, (56.3,71.8) 19,890 Clerks 64.9(53.2,75.1) 10, (43.9,70.6) 6,187 SpecializedTechnicians 66.3(56.5,74.9) 21, (47.4,69.4) 12,308 Medical/HealthPersonnel 55.4(42.0,68.1) 8, (37.0,63.0) 6,970 TeachingStaff 54.8(44.8,64.4) 8, (37.9,60.0) 6,531 Soldiers 80.7(31.9,97.4)* (10.4,94.4)* 298 Students 30.2(22.1,39.8) 13, (22.1,39.7) 13,792 NoJobs 88.9(75.4,95.5) 2, (70.9,96.1)* 1,681 Retired 50.8(19.0,82.0) 1, (11.6,84.0) 1,339 Others 74.6(41.8,92.3)* 1, (8.1,88.3)* 431 Region East 62.6(55.9,68.9) 124, (47.2,62.1) 78,649 Central 61.8(56.7,66.7) 55, (43.0,60.1) 31,888 West 66.0(58.4,72.9) 66, (49.5,66.0) 40,507 1 Inthepast30days.Amongthoserespondentswhoworkoutsideofthehomeandusuallyworkindoorsorbothindoorsandoutdoors. 2 Educationlevelisreportedonlyamongrespondents25+yearsold. *Estimatebasedonlessthan25unweightedcases. 168
195 Demographic Characteristics Table6.4:Percentageofadults15yearsoldwhovisitedvariouspublicplacesinthepast30daysand wereawareoftobaccosmoke,bysmokingstatusandselecteddemographiccharacteristics GATS China,2010. AwarenessofTobaccoSmoke 1 in GovernmentBuildings HealthCareFacilities Restaurants PublicTransportation InSchool Overall 2 Percentage(95%CI) Overall 58.4(50.8,65.7) 37.9(33.0,43.1) 88.5 (86.3,90.3) 34.1 (28.6,40.0) 36.9(30.7,43.6) 72.7 (69.4,75.8) Gender Male 62.6(55.0,69.5) 41.2(34.7,48.1) 91.8 (89.7,93.5) 36.4 (30.1,43.1) 43.8(37.2,50.7) 81.1 (78.2,83.7) Female 50.7(40.6,60.8) 35.2(31.0,39.6) 83.3 (80.1,86.2) 31.5 (26.3,37.2) 29.6(22.6,37.8) 63.3 (58.9,67.5) Age(years) (47.1,80.4) 37.0(28.1,46.9) 86.2 (81.5,89.9) 35.1 (28.8,41.9) 55.9(45.6,65.7) 79.3 (73.8,83.9) (48.2,62.5) 38.2(32.3,44.4) 91.0 (88.8,92.8) 36.9 (29.3,45.3) 28.2(21.1,36.6) 77.1 (73.5,80.3) (50.9,68.2) 37.9(32.8,43.2) 88.1 (85.8,90.0) 31.0 (25.7,36.8) 34.0(27.9,40.7) 66.8 (63.7,69.8) (43.1,72.6) 38.2(31.5,45.5) 73.4 (65.0,80.5) 23.5 (18.3,29.6) 23.3(16.2,32.3) 48.6 (42.5,54.8) Residence Urban 56.3(47.5,64.7) 32.2(27.0,37.9) 88.5 (85.5,91.0) 26.8 (19.2,36.0) 36.2(28.6,44.7) 75.4 (71.2,79.3) Rural 61.0(47.2,73.3) 42.5(34.8,50.5) 88.4 (85.3,90.9) 41.8 (33.7,50.4) 37.7(28.2,48.2) 70.0 (65.4,74.3) EducationLevel 3 PrimarySchoolorLess 56.6(40.6,71.3) 40.0(34.0,46.4) 82.6 (77.9,86.4) 37.9 (31.9,44.3) 22.3(16.2,29.8) 55.3 (50.6,59.9) AttendedSecondarySchool 64.1(52.0,74.7) 38.1(31.7,44.9) 91.2 (88.9,93.0) 37.9 (31.2,45.2) 29.6(21.3,39.6) 72.4 (68.9,75.7) HighSchoolGraduate 51.3(41.7,60.9) 36.3(29.9,43.2) 90.1 (88.1,91.7) 26.5 (19.1,35.6) 28.4(21.5,36.6) 76.9 (73.2,80.3) CollegeGraduateorAbove 55.7(45.7,65.2) 35.4(26.9,44.8) 89.9 (85.4,93.1) 28.2 (19.5,39.0) 38.1(31.2,45.5) 86.2 (82.2,89.4) Occupation AgricultureWorker 70.1(50.1,84.6) 45.2(35.5,55.3) 87.1 (81.7,91.1) 41.7 (35.0,48.6) 31.6(16.9,51.3) 64.0 (56.7,70.6) MachineOperator 61.5(40.9,78.6) 34.5(26.7,43.3) 94.2 (91.7,95.9) 35.9 (25.0,48.5) 25.7(16.8,37.2) 81.1 (75.7,85.4) BusinessorService Employee 54.6(42.9,65.7) 35.2(28.9,42.1) 91.0 (88.2,93.3) 33.5 (26.9,40.7) 29.9(21.0,40.7) 81.0 (77.9,83.8) LeadersofOrganizations 65.7(55.2,74.9) 32.8(19.9,48.9) 91.7 (87.4,94.6) 30.3 (19.0,44.5) 34.6(23.6,47.5) 88.6 (83.1,92.5) Clerks 49.6(33.7,65.5) 29.8(16.3,48.1) 92.0 (84.2,96.1) 20.9 (10.0,38.6) 19.1(8.4,37.7) 84.4 (75.3,90.5) SpecializedTechnicians 47.6(31.8,64.0) 20.5(12.5,32.0) 89.5 (84.3,93.2) 24.1 (15.9,34.7) 17.5(7.3,36.5) 80.9 (73.9,86.3) Medical/HealthPersonnel 57.4(30.6,80.5) 62.9(47.1,76.4) 91.6 (83.6,95.9) 38.3 (24.2,54.6) 34.8(18.2,56.3) 89.4 (80.7,94.4) TeachingStaff 38.2(19.5,61.1) 42.5(27.3,59.2) 89.0 (78.1,94.8) 34.9 (24.0,47.6) 56.6(44.7,67.8) 86.5 (76.9,92.5) Soldiers 98.0(84.1,99.8)* 15.0(1.7,63.6)* (,)* 57.6 (19.4,88.5)* 100.0(,)* 87.3 (47.4,98.1)* Students 68.1(32.8,90.3)* 34.9(22.1,50.4) 78.4 (68.8,85.7) 28.0 (20.4,37.2) 58.6(48.3,68.1) 81.3 (73.9,86.9) NoJobs 28.8(15.9,46.3) 34.3(28.6,40.6) 87.7 (81.9,91.8) 44.0 (33.0,55.7) 25.7(13.0,44.7) 65.3 (58.6,71.3) Retired 50.8(34.2,67.2) 26.2(18.7,35.5) 78.6 (73.4,83.0) 17.8 (11.5,26.6) 17.6(10.3,28.4) 50.7 (45.7,55.7) Others 58.9(18.5,90.0)* 18.5(7.8,38.0) 91.3 (70.1,97.9) 26.5 (8.5,58.3) 7.8(1.3,34.6)* 72.0 (54.6,84.6) Region East 53.1(44.8,61.3) 31.1(25.9,36.9) 88.6 (84.8,91.6) 26.9 (17.9,38.3) 36.0(26.9,46.3) 72.1 (66.2,77.4) Central 52.8(40.5,64.9) 36.5(29.9,43.6) 88.6 (85.8,91.0) 36.3 (26.1,47.9) 35.2(28.0,43.1) 73.2 (69.1,76.9) West 68.4(53.1,80.5) 45.9(35.0,57.3) 88.2 (83.9,91.4) 39.9 (31.9,48.6) 39.5(26.4,54.2) 73.0 (66.3,78.8) 1 Amongalladultswhovisitedtheplaceinthepast30days. 2 Awareoftobaccosmokeinanyofthefivelocationslistedinthetable. 3 Educationlevelisreportedonlyamongrespondents25+yearsold. *Estimatebasedonlessthan25unweightedcases. 169
196 Demographic Characteristics Table6.4(cont.):Percentageofadults15yearsoldwhovisitedvariouspublicplacesinthepast30 daysandwereexposedtotobaccosmoke,bysmokingstatusandselecteddemographiccharacteristics GATSChina,2010. AwarenessofTobaccoSmoke 1 in GovernmentBuildings HealthCareFacilities Restaurants PublicTransportation InSchool Overall 2 Percentage(95%CI) NonSmoker 55.4(47.3,63.1) 34.4(30.2,38.8) 84.6 (81.6,87.1) 31.8 (26.6,37.4) 35.7(29.6,42.3) 67.1 (63.3,70.8) Gender Male 60.8(52.0,68.9) 32.3(26.7,38.5) 86.7 (83.1,89.7) 32.2 (25.5,39.6) 45.6(38.3,53.0) 74.8 (70.8,78.4) Female 50.9(40.7,61.1) 35.2(30.9,39.6) 83.1 (79.8,85.9) 31.5 (26.3,37.3) 29.7(22.6,37.9) 63.1 (58.7,67.3) Age(years) (42.3,81.0) 37.3(27.9,47.7) 83.6 (77.5,88.3) 33.0 (26.6,40.1) 55.4(45.3,65.1) 76.5 (69.9,82.1) (43.6,61.9) 34.9(29.7,40.5) 87.9 (84.8,90.4) 35.3 (28.1,43.3) 24.6(17.9,32.6) 71.3 (67.3,75.0) (45.5,64.8) 31.9(27.0,37.2) 82.0 (78.8,84.8) 27.6 (22.6,33.3) 29.0(22.1,37.0) 57.7 (54.2,61.1) (30.4,67.7) 33.9(27.6,40.8) 67.6 (57.3,76.4) 19.2 (14.3,25.3) 21.5(13.0,33.5) 43.8 (37.7,50.0) Residence Urban 53.7(43.6,63.5) 30.5(25.6,35.8) 85.3 (81.6,88.4) 25.7 (18.9,33.9) 35.2(27.3,44.1) 70.7 (66.0,75.1) Rural 57.8(43.7,70.7) 37.9(31.3,44.9) 83.5 (78.6,87.4) 39.0 (31.1,47.5) 36.3(27.4,46.3) 63.3 (57.8,68.4) EducationLevel 3 PrimarySchoolorLess 49.8(31.6,68.1) 34.7(29.0,40.8) 76.3 (70.8,81.1) 34.1 (28.2,40.5) 19.1(13.0,27.3) 48.3 (43.6,53.1) AttendedSecondarySchool 60.6(47.5,72.3) 31.8(27.0,37.0) 87.3 (83.9,90.2) 35.2 (28.8,42.1) 23.8(15.9,34.0) 64.8 (60.4,69.0) HighSchoolGraduate 49.5(38.2,60.8) 34.9(27.3,43.3) 85.8 (83.0,88.1) 24.0 (17.2,32.4) 24.1(17.8,31.6) 69.6 (65.5,73.4) CollegeGraduateorAbove 52.5(42.7,62.2) 34.2(25.7,44.0) 87.0 (81.5,91.0) 28.6 (19.3,40.1) 36.6(29.5,44.3) 82.7 (77.9,86.6) Occupation AgricultureWorker 63.1(41.1,80.8) 38.8(30.5,47.8) 80.4 (72.0,86.7) 37.9 (31.3,45.0) 25.7(14.6,41.2) 55.2 (47.7,62.6) MachineOperator 75.7(49.3,90.8) 27.5(18.1,39.5) 89.5 (84.2,93.2) 32.9 (23.9,43.3) 19.3(8.3,38.7) 70.6 (59.9,79.4) BusinessorService Employee 50.8(35.6,65.9) 33.2(26.1,41.0) 89.4 (86.3,91.9) 30.9 (24.6,38.1) 24.9(17.0,34.8) 77.1 (73.5,80.3) LeadersofOrganizations 60.3(47.9,71.6) 29.5(17.1,45.8) 87.7 (81.6,92.0) 30.5 (17.1,48.3) 31.8(20.3,46.0) 85.7 (79.4,90.3) Clerks 55.8(34.8,74.8) 20.5(11.3,34.3) 89.9 (78.9,95.5) 20.2 (9.7,37.4) 13.9(5.1,32.4) 78.6 (64.9,88.0) SpecializedTechnicians 43.7(25.8,63.4) 22.3(12.6,36.4) 84.2 (76.5,89.7) 23.2 (14.3,35.5) 17.1(5.2,43.4) 76.6 (67.8,83.6) Medical/HealthPersonnel 58.0(30.6,81.1) 58.8(41.8,73.9) 90.8 (81.5,95.7) 35.8 (19.8,55.9) 32.9(16.2,55.4) 87.9 (78.0,93.6) TeachingStaff 33.0(16.1,56.0) 38.9(24.0,56.1) 86.7 (73.8,93.8) 37.0 (25.5,50.3) 51.2(39.9,62.5) 85.5 (74.4,92.2) Soldiers 100.0(,)* 0.9(0.1,9.6)* (,)* 47.0 (7.2,91.0)* 100.0(,)* 78.3 (26.1,97.3)* Students 68.1(32.8,90.3)* 34.9(21.9,50.7) 78.0 (68.2,85.5) 28.5 (20.7,37.9) 58.5(48.3,68.0) 81.0 (73.5,86.8) NoJobs 30.0(15.2,50.6) 33.9(27.7,40.7) 86.2 (79.4,91.1) 42.2 (31.7,53.4) 22.8(11.7,39.9) 61.4 (55.0,67.5) Retired 47.8(27.2,69.3) 25.9(18.8,34.6) 74.7 (68.4,80.2) 16.6 (10.8,24.6) 16.2(8.6,28.4) 46.9 (41.4,52.4) Others 63.6(17.3,93.6)* 9.1(5.3,15.1) 83.9 (50.3,96.4)* 13.8 (3.9,38.6) 7.8(1.0,41.9)* 61.2 (39.7,79.1) Region East 50.1(41.9,58.3) 28.6(23.5,34.4) 85.1 (79.9,89.2) 23.5 (15.8,33.4) 35.7(25.7,47.1) 66.8 (59.5,73.3) Central 47.4(34.7,60.5) 34.3(28.3,40.9) 84.1 (80.1,87.4) 35.8 (26.2,46.7) 34.7(26.5,43.9) 67.9 (63.5,72.0) West 66.3(49.6,79.7) 40.9(31.6,50.8) 84.3 (78.5,88.8) 38.1 (29.9,47.0) 36.6(25.4,49.5) 66.9 (59.4,73.6) 1 Amongalladultswhovisitedtheplaceinthepast30days. 2 Awareoftobaccosmokeinanyofthefivelocationslistedinthetable. 3 Educationlevelisreportedonlyamongrespondents25+yearsold. *Estimatebasedonlessthan25unweightedcases. 170
197 Table6.5:Percentagedistributionofadults15yearsold,byworkplacesmokingpolicy,andselected demographiccharacteristics GATSChina,2010. Demographic Characteristics SmokingPolicyinWorkplace 1 NoPolicy PartialBan CompleteBan Percentage(95%CI) % N Overall 37.7 (33.9,41.6) 31.3 (27.0,35.9) 31.0 (27.8,34.5) 100 3,877 Gender Male 41.8 (37.9,45.8) 32.2 (28.6,36.1) 26.0 (22.3,30.1) 100 2,122 Female 32.2 (27.4,37.4) 30.1 (23.7,37.4) 37.7 (32.7,43.0) 100 1,755 Age(years) (21.5,31.8) 31.3 (25.8,37.5) 42.3 (35.8,49.1) (36.2,44.2) 31.4 (26.2,37.1) 28.5 (24.4,33.0) 100 2, (42.5,52.1) 31.1 (25.2,37.5) 21.7 (18.0,25.9) 100 1, (30.6,71.9) 29.7 (15.9,48.5) 18.8 (10.6,31.3) Residence Urban 36.5 (30.8,42.5) 31.5 (26.3,37.2) 32.0 (28.1,36.2) 100 2,648 Rural 39.9 (35.7,44.2) 30.9 (24.6,38.0) 29.2 (24.0,35.1) 100 1,229 EducationLevel 2 PrimarySchoolorLess 56.2 (45.0,66.8) 22.3 (15.5,31.0) 21.5 (14.9,30.1) AttendedSecondarySchool 52.1 (47.0,57.2) 22.5 (17.5,28.4) 25.4 (20.8,30.5) 100 1,070 HighSchoolGraduate 38.4 (33.4,43.7) 34.6 (27.9,42.0) 27.0 (21.6,33.2) CollegeGraduateorAbove 30.3 (25.8,35.1) 41.2 (34.3,48.4) 28.5 (23.5,34.2) Occupation AgricultureWorker 72.0 (63.7,79.1) 16.7 (9.6,27.4) 11.3 (5.6,21.4) MachineOperator 40.4 (32.3,49.1) 27.1 (21.5,33.6) 32.5 (24.9,41.0) BusinessorService Employee 49.1 (42.6,55.7) 25.6 (20.2,31.9) 25.3 (20.7,30.5) 100 1,078 LeadersofOrganizations 37.8 (31.9,44.1) 36.8 (27.8,46.7) 25.5 (17.8,35.0) Clerks 40.5 (30.2,51.7) 46.1 (34.8,57.8) 13.4 (8.2,21.3) SpecializedTechnicians 34.4 (25.6,44.4) 43.7 (34.0,53.8) 22.0 (15.5,30.1) Medical/HealthPersonnel 15.3 (8.8,25.3) 36.6 (25.2,49.8) 48.1 (34.9,61.6) TeachingStaff 21.7 (15.1,30.2) 36.5 (24.6,50.3) 41.8 (30.2,54.3) Soldiers 30.8 (6.4,74.4)* 64.2 (23.8,91.2)* 5.0 (0.6,30.2)* Students 3.6 (1.9,6.8) 32.7 (22.9,44.2) 63.7 (52.3,73.8) NoJobs 53.7 (27.3,78.2) 37.6 (14.8,67.6) 8.7 (2.1,29.7) Retired 55.1 (23.1,83.4) 26.2 (8.3,58.2) 18.7 (9.2,34.4) Others 38.7 (22.6,57.7)* 55.5 (34.4,74.8)* 5.8 (0.6,38.0)* Region East 37.3 (31.2,43.8) 29.4 (22.6,37.2) 33.3 (28.5,38.5) 100 1,704 Central 35.9 (30.9,41.2) 30.4 (26.2,35.0) 33.7 (28.8,39.0) West 39.9 (33.2,46.9) 35.9 (27.8,44.8) 24.3 (18.4,31.3) 100 1,310 1 Amongthoserespondentswhoworkoutsideofthehomeandusuallyworkindoorsorbothindoorsandoutdoors. 2 Educationlevelisreportedonlyamongrespondents25+yearsold. *Estimatebasedonlessthan25unweightedcases. Total 171
198 Table6.6:Percentageofadults15yearsoldwhoreportedsmokingoccurredintheirworkplace,by workplacesmokingpolicyandselecteddemographiccharacteristics GATSChina,2010. Demographic Characteristics Adults 1 ReportingSmokingOccurredinWorkplaceswith NoPolicyon Smoking APartialBanon Smoking ACompleteBanon Smoking Percentage(95%CI) Overall 89.2 (86.2,91.6) 69.3 (63.5,74.6) 25.5 (20.1,31.7) Gender Male 91.9 (89.4,93.9) 73.4 (66.7,79.1) 33.9 (24.6,44.6) Female 84.4 (78.7,88.9) 63.6 (55.1,71.4) 18.0 (13.7,23.2) Age(years) (74.5,93.7) 57.9 (47.0,68.1) 21.2 (15.3,28.6) (86.3,92.7) 73.3 (68.1,78.0) 25.7 (19.3,33.4) (86.4,93.9) 77.3 (68.1,84.5) 37.5 (25.6,51.1) (41.0,74.9) 39.6 (11.4,76.9) 4.0 (0.5,26.5)* Residence Urban 90.4 (87.7,92.5) 65.3 (57.5,72.4) 27.3 (20.5,35.4) Rural 87.1 (81.1,91.4) 77.1 (70.7,82.4) 21.6 (14.7,30.7) EducationLevel 2 PrimarySchoolorLess 85.4 (75.7,91.7) 77.5 (60.2,88.7) 30.8 (16.4,50.3) AttendedSecondarySchool 92.0 (88.9,94.2) 80.2 (72.5,86.1) 24.3 (16.0,35.2) HighSchoolGraduate 89.1 (82.1,93.6) 75.9 (68.2,82.2) 27.9 (17.3,41.8) CollegeGraduateorAbove 89.1 (80.8,94.0) 68.0 (61.3,74.1) 31.8 (23.2,41.9) Occupation AgricultureWorker 87.1 (75.3,93.8) 89.5 (63.7,97.6) 6.4 (1.2,28.4)* MachineOperator 86.6 (78.3,92.0) 77.4 (68.8,84.2) 17.0 (10.8,25.9) BusinessorService Employee 93.7 (88.5,96.6) 73.3 (62.2,82.1) 26.9 (17.9,38.4) LeadersofOrganizations 92.2 (87.5,95.2) 77.7 (69.1,84.4) 37.1 (28.5,46.6) Clerks 78.7 (49.9,93.2) 63.3 (49.9,74.9) 29.3 (14.1,51.0) SpecializedTechnicians 94.8 (88.4,97.8) 69.7 (55.3,81.0) 15.0 (8.1,26.2) Medical/HealthPersonnel 65.1 (31.9,88.2)* 66.9 (48.9,81.0) 43.6 (25.9,63.1) TeachingStaff 76.5 (50.2,91.3) 66.6 (54.2,77.1) 32.4 (19.0,49.5) Soldiers (,)* 69.9 (17.6,96.2)* (,)* Students 56.7 (27.4,82.0)* 43.7 (28.2,60.6) 22.3 (14.8,32.3) NoJobs 86.7 (66.0,95.7)* 89.0 (55.1,98.2)* (,)* Retired 72.0 (33.9,92.8)* 41.7 (6.1,88.8) 6.7 (0.7,41.4)* Others 85.2 (58.3,96.0)* 64.5 (31.6,87.7)* (,)* Region East 88.9 (84.5,92.2) 67.4 (57.9,75.7) 28.2 (20.1,38.1) Central 88.1 (82.2,92.2) 75.9 (68.6,81.9) 21.2 (14.6,29.8) West 90.6 (83.8,94.7) 67.4 (56.0,77.0) 23.4 (16.6,31.8) 1 Inthepast30days.Amongthoserespondentswhoworkoutsideofthehomeandusuallyworkindoorsorboth indoorsandoutdoors. 2 Educationlevelisreportedonlyamongrespondents25+yearsold. *Estimatebasedonlessthan25unweightedcases. 172
199 Table7.1:Medianamountspentper20manufacturedcigarettesamongmanufacturedcigarette smokers15yearsold,byselecteddemographiccharacteristics GATSChina,2010. Demographic Characteristics MedianAmountSpentPer20Cigarettes Average(95%CI) N Overall 5.0 (4.9,6.1) 3,541 Gender Male 5.0 (4.9,6.0) 3,379 Female 3.9 (2.5,5.5) 162 Age(years) (5.0,8.0) (5.2,7.1) 1, (4.3,5.0) 1, (2.9,4.0) 411 Residence Urban 7.0 (6.3,10.0) 1,458 Rural 4.9 (4.3,5.0) 2,083 EducationLevel 1 PrimarySchoolorLess 3.0 (2.9,3.8) 1,047 AttendedSecondarySchool 4.9 (4.9,5.0) 1,395 HighSchoolGraduate 7.1 (6.0,9.8) 600 CollegeGraduateorAbove 9.9 (9.8,11.8) 318 Occupation AgricultureWorker 3.9 (3.2,5.1) 1,417 MachineOperator 5.5 (5.0,7.0) 595 BusinessorServiceEmployee 7.4 (5.8,9.7) 500 LeadersofOrganizations 9.9 (6.9,11.2) 234 Clerks 9.3 (5.7,12.7) 80 SpecializedTechnicians 7.0 (5.0,9.7) 176 Medical/HealthPersonnel 9.8 (6.3,11.0) 26 TeachingStaff 8.9 (5.3,10.4) 36 Soldiers 10.5 (,)* 4 Students 8.2 (5.1,)* 9 NoJobs 4.9 (4.6,6.0) 187 Retired 4.9 (4.8,5.0) 244 Others 3.5 (2.2,6.4) 31 Region East 6.4 (5.1,8.1) 1,091 Central 4.8 (3.9,4.9) 1,086 West 5.0 (4.9,7.0) 1,364 1 Educationlevelisreportedonlyamongrespondents25+yearsold. *Estimatebasedonlessthan25unweightedcases. 173
200 Table7.2Percentileofamountspentperpackofcigarettes,GATSChina2010. Percentile DemographicCharacteristics P10 P25 P50 P75 P90 Overall Residence Urban Rural AgeGroup Occupations Agricultureworker Machineoperator Leadersoforganizations Region East Central West
201 Table7.3TransferpricesandretailpricesofdifferentclassesofcigarettesinChina,2010 Classofcigarettes Transferprices(Yuan) Retailprices(Yuan) Retailprices(US$) Five <1.65 <2.18 <0.32 Four Three Two One Note:US$1=6.7909YuanRMB,asofJune30,
202 Table7.4ChineseSmokersConsumingCigarettesofDifferentclasses,2010 Classesofcigarettes Retailprices(Yuan) Retailprices (US$) Numberofsmokers (million) Percent(%) Cumulativenumberof smokers(million) Cumulative percent(%) Five (1,2.18) (0.15,0.32) Four [2.18,4.13) [0.32,0.61) Three [4.13,5] [0.61,0.74] Three (5,7.19) (0.74,1.06) Three [7.19,10.07) [1.06,1.48) Two [10.07,14.84) [1.48,2.19) One [14.84,200) [2.19,29.45) Note:US$1=6.7909YuanRMB,asofJune30,
203 Table7.5:Medianamountspenton100packsofmanufacturedcigarettesasapercentageofpercapita GDPamongcurrentmanufacturedcigarettesmokers15yearsold,byselecteddemographic characteristics GATSChina,2010. Demographic Characteristics AmountSpenton100PacksofCigarettes asapercentageofpercapitagdp Median(95%CI) N Overall 2.0 (2.0,2.4) 3,541 Gender Male 2.0 (2.0,2.4) 3,379 Female 1.5 (1.0,2.2) 162 Age(years) (2.0,3.2) (2.1,2.8) 1, (1.7,2.0) 1, (1.1,1.6) 411 Residence Urban 2.8 (2.5,4.0) 1,458 Rural 2.0 (1.7,2.0) 2,083 EducationLevel 1 PrimarySchoolorLess 1.2 (1.2,1.5) 1,047 AttendedSecondarySchool 2.0 (1.9,2.0) 1,395 HighSchoolGraduate 2.8 (2.4,3.9) 600 CollegeGraduateorAbove 3.9 (3.9,4.7) 318 Occupation AgricultureWorker 1.6 (1.3,2.0) 1,417 MachineOperator 2.2 (2.0,2.8) 595 BusinessorServiceEmployee 2.9 (2.3,3.9) 500 LeadersofOrganizations 3.9 (2.8,4.5) 234 Clerks 3.7 (2.3,5.1) 80 SpecializedTechnicians 2.8 (2.0,3.9) 176 Medical/HealthPersonnel 3.9 (2.5,4.4) 26 TeachingStaff 3.5 (2.1,4.2) 36 Soldiers 4.2 (,)* 4 Students 3.3 (2.0,)* 9 NoJobs 1.9 (1.8,2.4) 187 Retired 1.9 (1.9,2.0) 244 Others 1.4 (0.9,2.5) 31 Region East 2.5 (2.0,3.2) 1,091 Central 1.9 (1.6,2.0) 1,086 West 2.0 (2.0,2.8) 1,364 1 Educationlevelisreportedonlyamongrespondents25+yearsold. *Estimatebasedonlessthan25unweightedcases. 177
204 Table7.6:Percentagedistributionofcurrentmanufacturedcigarettesmokers15yearsold,bylastbrandpurchasedandselecteddemographiccharacteristics GATSChina,2010. DemographicCharacteristics Lastcigarettebrandpurchased Honghe Hongtashan Yunyan Baisha Nanjing Huangguoshu Hongshuangxi Hongqiqu Hongjilong Hongmei Liqun OtherBrand Percentage(95%CI) Overall 6.4 (3.7,10.8) 6.2 (4.5,8.3) 4.9 (3.6,6.6) 4.5 (3.0,6.8) 4.4 (1.5,12.3) 4.6 (2.0,10.6) 4.2 (2.7,6.6) 3.8 (2.0,7.3) 3.8 (1.6,8.7) 3.9 (2.7,5.6) 3.5 (1.8,6.5) 40.5 (34.3,47.0) Gender Male 6.5 (3.7,11.0) 6.2 (4.5,8.3) 5.0 (3.6,6.8) 4.6 (3.0,6.9) 4.5 (1.5,12.6) 4.6 (1.9,10.8) 4.2 (2.7,6.6) 3.9 (2.0,7.5) 3.8 (1.6,8.9) 3.8 (2.6,5.5) 3.4 (1.7,6.4) 40.0 (33.8,46.6) Female 3.4 (1.1,10.2) 6.4 (2.2,16.8) 1.7 (0.6,4.6) 1.6 (0.6,4.0) 1.6 (0.2,11.0) 4.5 (1.8,10.9) 4.6 (1.1,17.6) 2.4 (0.8,6.4) 4.1 (1.7,9.7) 7.3 (3.3,15.4) 6.5 (1.0,32.5) 53.9 (38.9,68.2) Age(years) (1.5,8.0) 12.3 (6.9,21.0) 8.1 (3.1,19.4) 4.7 (2.3,9.6) 1.9 (0.6,5.7) 5.7 (2.0,15.0) 4.6 (2.0,10.4) 1.6 (0.2,10.6) 3.1 (1.0,9.4) 0.5 (0.1,3.8) 5.3 (1.9,13.4) 44.7 (33.6,56.3) (3.6,13.2) 6.2 (4.3,8.9) 5.2 (3.5,7.6) 4.0 (2.4,6.8) 5.8 (2.0,16.0) 4.8 (1.8,12.3) 3.4 (1.9,5.9) 4.4 (2.3,8.4) 3.7 (1.4,9.6) 3.7 (2.2,6.3) 4.2 (2.2,7.9) 36.0 (28.9,43.8) (3.9,10.6) 4.0 (2.4,6.7) 3.7 (2.4,5.7) 5.1 (3.1,8.4) 4.1 (1.2,12.7) 3.6 (1.7,7.6) 5.0 (2.7,9.0) 4.0 (1.9,7.9) 4.1 (2.1,7.8) 4.8 (3.5,6.7) 2.4 (1.2,4.5) 43.7 (36.5,51.1) (4.0,13.9) 2.8 (1.3,5.9) 1.4 (0.6,3.7) 4.2 (2.3,7.4) 1.4 (0.4,4.2) 6.2 (2.1,17.2) 5.3 (2.3,11.9) 4.3 (1.7,10.1) 4.5 (1.1,16.5) 7.8 (3.6,16.1) 0.0 (,) 46.1 (35.4,57.1) Residence Urban 4.3 (2.6,6.9) 6.3 (3.7,10.3) 7.4 (5.1,10.7) 4.5 (2.6,7.6) 9.2 (3.3,23.4) 4.2 (1.0,15.6) 4.8 (2.7,8.3) 1.6 (0.5,4.6) 4.5 (1.0,17.8) 2.9 (1.8,4.7) 4.4 (2.5,7.7) 32.4 (26.1,39.5) Rural 8.1 (3.9,16.1) 6.1 (4.1,8.9) 2.8 (1.7,4.6) 4.6 (2.5,8.0) 0.5 (0.1,2.8) 5.0 (2.1,11.4) 3.8 (2.0,7.1) 5.7 (2.6,11.9) 3.2 (1.6,6.4) 4.7 (2.9,7.3) 2.7 (0.7,10.0) 46.9 (38.4,55.7) EducationLevel 1 PrimarySchoolorLess 4.5 (2.2,9.0) 2.0 (0.9,4.3) 2.2 (1.2,4.1) 4.6 (2.4,8.4) 0.8 (0.2,2.9) 6.4 (2.9,13.4) 3.0 (1.4,6.4) 7.1 (3.8,13.0) 5.3 (1.9,14.3) 5.8 (3.6,9.2) 1.4 (0.3,5.3) 48.7 (40.3,57.2) AttendedSecondarySchool 8.8 (4.3,17.2) 5.9 (3.7,9.3) 3.1 (1.8,5.1) 4.5 (2.7,7.3) 4.4 (1.4,13.1) 4.0 (2.0,8.0) 4.6 (2.7,7.7) 5.0 (2.6,9.6) 4.9 (2.1,11.1) 4.5 (2.6,7.8) 3.0 (1.2,7.1) 40.3 (32.1,49.0) HighSchoolGraduate 5.7 (3.3,9.7) 6.1 (3.5,10.4) 6.1 (3.7,10.0) 4.6 (2.8,7.5) 8.5 (2.6,24.2) 3.8 (0.7,18.1) 4.7 (2.2,9.7) 1.4 (0.6,3.4) 2.0 (0.8,5.3) 3.9 (1.9,7.7) 3.5 (1.8,6.7) 35.6 (27.2,45.1) CollegeGraduateorAbove 6.1 (2.9,12.4) 6.5 (4.0,10.4) 10.2 (5.9,17.0) 4.0 (1.8,8.6) 7.4 (1.9,24.9) 3.5 (0.6,18.4) 3.6 (1.5,8.3) 0.7 (0.2,2.2) 0.9 (0.2,3.1) 2.6 (1.0,6.6) 7.1 (3.8,12.9) 27.0 (18.6,37.4) Occupation AgricultureWorker 4.2 (2.3,7.6) 5.9 (3.5,9.6) 1.7 (1.0,3.1) 3.5 (1.7,7.2) 0.6 (0.2,2.2) 6.6 (2.5,16.7) 2.5 (1.2,5.3) 6.5 (3.0,13.3) 6.4 (2.4,16.0) 5.2 (2.8,9.5) 0.5 (0.1,1.7) 51.2 (42.4,59.9) MachineOperator 8.7 (4.1,17.4) 6.9 (4.4,10.8) 5.2 (3.1,8.6) 4.0 (2.1,7.5) 5.9 (1.9,16.4) 1.3 (0.5,3.4) 5.0 (2.7,9.0) 3.8 (1.9,7.5) 4.1 (1.5,10.7) 3.0 (1.6,5.5) 6.0 (1.5,21.1) 38.6 (29.4,48.6) BusinessorServiceEmployee 4.8 (2.2,10.1) 6.5 (3.1,13.1) 8.0 (3.7,16.4) 6.1 (3.5,10.5) 8.8 (2.8,24.1) 4.2 (1.5,10.8) 3.8 (1.8,7.7) 2.8 (0.6,12.3) 1.6 (0.8,3.3) 3.4 (1.5,7.8) 5.2 (3.0,8.7) 31.3 (24.4,39.0) LeadersofOrganizations 11.3 (4.8,24.2) 2.0 (0.4,8.8) 7.0 (3.6,13.2) 3.4 (1.1,9.9) 6.0 (1.6,19.7) 4.9 (0.7,26.9) 5.1 (2.0,12.7) 0.0 (,) 1.0 (0.2,3.9) 2.9 (1.1,7.8) 10.9 (3.3,30.3) 28.6 (17.1,43.8) Clerks 9.8 (2.1,35.4) 5.3 (2.3,11.8) 6.7 (2.8,15.4) 9.3 (4.1,19.6) 2.6 (0.3,17.2) 1.3 (0.3,5.0) 3.8 (1.2,10.9) 0.0 (,) 2.2 (0.4,11.2) 1.8 (0.3,11.9) 0.9 (0.1,6.7) 40.5 (22.6,61.4) SpecializedTechnicians 2.4 (0.7,7.5) 7.3 (3.5,14.6) 7.1 (3.3,14.4) 5.4 (2.5,11.0) 6.4 (1.5,23.4) 7.2 (1.4,29.4) 9.0 (3.8,19.6) 3.4 (0.7,14.3) 4.1 (1.2,13.3) 0.4 (0.1,1.8) 3.6 (1.5,8.4) 34.4 (23.5,47.2) Medical/HealthPersonnel 8.4 (1.6,33.7) 1.7 (0.2,12.0) 22.9 (9.0,47.2) 0.8 (0.1,6.0) 12.0 (1.6,53.4) 0.0 (,) 0.0 (,) 0.0 (,) 3.6 (0.8,14.9) 1.8 (0.2,13.1) 0.0 (,) 26.3 (8.5,57.8) TeachingStaff 7.8 (1.6,31.1) 8.3 (1.6,33.5) 4.9 (0.9,22.1) 1.5 (0.3,6.9) 15.7 (2.7,56.1) 0.0 (,) 2.7 (0.3,19.1) 2.9 (0.4,18.9) 8.3 (1.8,30.8) 6.1 (0.8,33.8) 8.0 (1.6,31.9) 20.9 (9.1,41.1) Soldiers 0.0 (,)* 0.0 (,)* 13.8 (1.4,64.2)* 0.0 (,)* 0.0 (,)* 0.0 (,)* 0.0 (,)* 0.0 (,)* 0.0 (,)* 0.0 (,)* 0.0 (,)* 86.2 (35.8,98.6)* Students 3.8 (0.5,24.1)* 43.2 (11.8,81.3)* 0.0 (,)* 0.0 (,)* 18.3 (2.5,66.3)* 0.0 (,)* 0.0 (,)* 0.0 (,)* 0.0 (,)* 0.0 (,)* 0.0 (,)* 34.7 (9.8,72.2)* NoJobs 6.0 (2.7,12.7) 7.9 (3.4,17.3) 2.9 (1.2,7.0) 6.3 (2.4,15.3) 4.0 (0.9,15.8) 4.9 (1.1,18.8) 8.3 (3.6,18.1) 3.0 (1.1,8.3) 2.1 (0.8,5.8) 2.8 (1.5,5.2) 0.1 (0.0,1.0) 44.6 (28.8,61.5) Retired 12.0 (5.3,24.9) 3.0 (1.1,8.0) 5.3 (1.7,15.5) 5.4 (3.1,9.5) 1.5 (0.3,7.6) 7.1 (1.6,26.6) 4.7 (2.3,9.3) 1.2 (0.4,3.6) 1.1 (0.4,3.1) 8.2 (4.0,16.2) 2.3 (0.8,6.3) 36.0 (24.7,49.2) Others 0.0 (,) 19.0 (7.1,42.0) 0.0 (,) 5.1 (1.0,22.2) 0.0 (,) 0.0 (,) 0.4 (0.1,2.9) 0.0 (,) 0.0 (,) 0.7 (0.1,6.0) 0.0 (,) 43.2 (22.7,66.4) Region East 3.0 (1.2,7.0) 2.8 (1.6,5.0) 2.9 (1.8,4.6) 3.3 (1.6,6.7) 11.9 (4.3,28.9) 0.8 (0.4,1.6) 8.3 (5.0,13.4) 1.1 (0.3,3.6) 1.3 (0.5,3.0) 2.7 (1.5,4.7) 7.6 (3.6,15.3) 45.7 (32.5,59.6) Central 4.0 (2.3,6.9) 5.3 (2.5,11.2) 2.8 (1.4,5.6) 6.6 (3.0,13.8) 0.1 (0.0,0.8) 1.2 (0.6,2.3) 1.1 (0.3,3.2) 12.3 (5.8,24.5) 12.1 (4.5,28.4) 3.1 (1.7,5.7) 2.5 (0.8,7.6) 44.0 (36.1,52.3) West 11.6 (5.2,23.8) 10.2 (7.3,14.0) 8.4 (5.3,13.0) 4.2 (2.3,7.5) 0.0 (0.0,0.2) 11.2 (3.9,28.3) 2.5 (1.0,6.6) 0.2 (0.1,0.7) 0.2 (0.0,1.2) 5.7 (3.1,10.4) 0.0 (0.0,0.0) 32.5 (23.2,43.4) Note:Currentmanufacturedcigarettesmokersincludesdailyandoccasional(lessthandaily)use.Thetopfivereportedbrandslastpurchasedamongallmanufacturedcigarettesmokersareshownhere. 1 Educationlevelisreportedonlyamongrespondents25+yearsold. *Estimatebasedonlessthan25unweightedcases. 178
205 Table7.7:Percentagedistributionofmanufacturedcigarettesmokers15yearsold,bythesourceoflastpurchaseofcigarettesandselecteddemographiccharacteristics GATSChina,2010. Gender Age(years) Residence Region Source Overall Male Female Urban Rural East Central West Percentage(95%CI) Kiosk/GasStation/Convenience Store 70.5 (63.1,77.0) 70.9 (63.6,77.2) 60.4 (41.3,76.8) 79.6 (66.5,88.5) 68.9 (61.6,75.5) 57.8 (49.7,65.6) 80.8 (70.1,88.2) 63.6 (52.2,73.6) 78.6 (63.2,88.8) 71.5 (57.9,82.0) DutyFreeShop 0.1 (0.0,0.6) 0.1 (0.0,0.5) 0.6 (0.1,3.8) 0.0 (,) 0.2 (0.0,0.7) 0.3 (0.1,1.3) 0.0 (0.0,0.1) 0.1 (0.0,0.2) 0.1 (0.0,0.7) 0.3 (0.0,1.8) BarEntertainmentVenues 0.0 (0.0,0.3) 0.0 (0.0,0.3) 0.0 (,) 0.0 (,) 0.1 (0.0,0.3) 0.1 (0.0,0.6) 0.0 (0.0,0.1) 0.0 (,) 0.0 (0.0,0.1) 0.1 (0.0,0.8) TobaccoStoreorLiquorStore 9.2 (6.9,12.1) 9.0 (6.7,11.9) 14.6 (7.4,26.8) 4.1 (1.9,8.3) 10.1 (7.5,13.4) 14.3 (10.7,18.8) 5.0 (2.8,9.0) 12.1 (7.8,18.3) 6.0 (3.1,11.4) 8.6 (5.6,12.8) Internet 0.0 (,) 0.0 (,) 0.0 (,) 0.0 (,) 0.0 (,) 0.0 (,) 0.0 (,) 0.0 (,) 0.0 (,) 0.0 (,) Hotel 0.0 (0.0,0.0) 0.0 (0.0,0.0) 0.0 (,) 0.0 (,) 0.0 (0.0,0.0) 0.0 (,) 0.0 (0.0,0.1) 0.0 (,) 0.0 (,) 0.0 (0.0,0.1) Store/SuperMarket 18.7 (13.5,25.4) 18.6 (13.4,25.2) 23.1 (12.6,38.4) 16.0 (8.8,27.5) 19.2 (13.8,26.1) 26.4 (19.5,34.8) 12.5 (7.0,21.4) 22.4 (14.2,33.7) 15.0 (7.5,27.7) 17.8 (9.4,31.0) StreetVendor 1.3 (0.6,2.9) 1.3 (0.6,2.9) 1.3 (0.2,8.0) 0.2 (0.1,1.0) 1.5 (0.6,3.3) 1.0 (0.3,3.4) 1.5 (0.5,4.2) 1.6 (0.4,6.9) 0.2 (0.0,0.7) 1.8 (0.8,4.1) VendingMachine 0.0 (,) 0.0 (,) 0.0 (,) 0.0 (,) 0.0 (,) 0.0 (,) 0.0 (,) 0.0 (,) 0.0 (,) 0.0 (,) Outsideofthecountry 0.0 (,) 0.0 (,) 0.0 (,) 0.0 (,) 0.0 (,) 0.0 (,) 0.0 (,) 0.0 (,) 0.0 (,) 0.0 (,) Others 0.1 (0.0,0.2) 0.1 (0.0,0.2) 0.0 (,) 0.0 (,) 0.1 (0.0,0.2) 0.0 (0.0,0.0) 0.1 (0.0,0.4) 0.2 (0.1,0.6) 0.0 (0.0,0.2) 0.0 (0.0,0.0) Total *Estimatebasedonlessthan25unweightedcases. 179
206 Table7.8:Mediancigaretteexpenditurepermonthamongmanufacturedcigarettesmokers15years old,byselecteddemographiccharacteristics GATSChina,2010. Demographic Characteristics Overall Gender Male Female Age(years) Residence Urban Rural EducationLevel 1 PrimarySchoolorLess AttendedSecondarySchool HighSchoolGraduate CollegeGraduateorAbove Occupation AgricultureWorker MachineOperator BusinessorServiceEmployee Leadersoforganizations Clerks SpecializedTechnicians Medical/HealthPersonnel TeachingStaff Soldiers Students NoJobs Retired Others Region East Central West Cigaretteexpenditurepermonth (Yuan) Median(95%CI) (94.4,125.6) (92.7,125.5) 59.9 (42.4,94.9) 90.7 (75.4,109.1) (112.5,154.5) (96.1,127.9) 65.3 (51.0,77.2) (126.3,152.1) 90.5 (77.5,107.1) 75.0 (68.2,82.5) (102.3,145.5) (115.0,152.6) (145.0,236.5) 75.8 (72.2,104.8) (95.8,147.9) (120.0,155.3) (109.0,189.2) (123.1,235.8) (89.6,175.0) (25.9,293.5) (74.6,200.5) 59.9 (,)* 38.3 (15.9,)* 91.2 (74.7,113.1) 97.7 (81.5,115.0) 74.8 (58.7,156.3) (83.3,155.6) 89.8 (75.5,108.2) (100.3,152.9) 1 Educationlevelisreportedonlyamongrespondents25+yearsold. *Estimatebasedonlessthan25unweightedcases. 180
207 Places Table8.1:Percentageofadults15yearsoldwhonoticedanticigarettesmokinginformationduringthe last30daysinvariousplaces,bysmokingstatusandselecteddemographiccharacteristics GATSChina, Overall Gender Age(years) Male Female Percentage(95%CI) Overall InNewspapersorinMagazines 21.8 (18.9,24.9) 24.6 (21.3,28.1) 18.8 (16.0,22.0) 24.0 (20.3,28.2) 21.1 (18.1,24.5) OnTelevisionortheRadio 46.4 (42.0,50.8) 48.5 (43.8,53.3) 44.1 (39.8,48.5) 47.6 (41.8,53.4) 46.0 (41.7,50.5) OnTelevision 45.4 (41.1,49.8) 47.4 (42.6,52.2) 43.3 (39.0,47.7) 46.7 (41.1,52.5) 45.0 (40.7,49.4) OntheRadio 6.0 (4.5,8.0) 6.9 (5.1,9.3) 5.1 (3.7,6.9) 4.7 (2.9,7.7) 6.4 (4.7,8.5) OnBillboards 20.5 (17.4,24.1) 22.4 (18.6,26.8) 18.5 (15.8,21.7) 21.8 (17.1,27.3) 20.2 (17.0,23.7) OnPoster 10.6 (8.2,13.7) 11.3 (8.6,14.6) 10.0 (7.7,12.9) 13.7 (10.4,17.9) 9.8 (7.4,12.9) OnPublicWalls 18.8 (15.4,22.8) 21.9 (17.7,26.9) 15.7 (12.8,19.0) 19.0 (14.7,24.2) 18.8 (15.3,22.9) InCinema 2.3 (1.7,3.2) 2.7 (1.8,4.1) 1.9 (1.4,2.5) 5.2 (3.2,8.4) 1.5 (1.1,2.1) OnInternet 8.1 (6.5,9.9) 9.6 (7.4,12.3) 6.5 (5.2,8.1) 16.5 (12.6,21.2) 5.8 (4.6,7.3) OnPublicTransportation 20.3 (16.8,24.3) 22.3 (18.3,26.9) 18.2 (14.8,22.1) 23.8 (18.8,29.8) 19.3 (15.9,23.2) SomewhereElse 2.7 (1.9,3.7) 3.2 (2.3,4.5) 2.1 (1.4,3.1) 3.4 (2.2,5.3) 2.5 (1.8,3.4) AnyLocation 59.8 (55.1,64.3) 63.6 (58.4,68.6) 55.7 (51.0,60.4) 65.2 (58.2,71.6) 58.3 (53.7,62.8) Currentsmokers InNewspapersorinMagazines 22.1 (18.4,26.4) 22.6 (18.8,26.9) 12.3 (5.8,24.1) 19.6 (13.4,27.6) 22.6 (18.6,27.1) OnTelevisionortheRadio 47.8 (42.0,53.7) 48.3 (42.4,54.2) 37.3 (27.3,48.6) 40.4 (28.4,53.7) 49.0 (43.5,54.5) OnTelevision 46.8 (41.1,52.7) 47.3 (41.5,53.1) 36.7 (26.9,47.9) 39.2 (27.5,52.4) 48.0 (42.6,53.5) OntheRadio 6.2 (4.2,9.0) 6.4 (4.3,9.3) 1.9 (0.8,4.5) 3.0 (1.4,6.6) 6.7 (4.5,9.8) OnBillboards 20.6 (16.6,25.3) 21.0 (17.0,25.7) 11.6 (5.8,21.8) 17.4 (10.5,27.5) 21.1 (17.1,25.8) OnPoster 9.6 (7.0,13.1) 9.9 (7.2,13.5) 2.9 (1.1,7.1) 12.6 (5.7,25.4) 9.2 (6.5,12.7) OnPublicWalls 20.6 (15.7,26.5) 21.2 (16.1,27.3) 7.2 (4.0,12.4) 19.6 (12.5,29.4) 20.7 (15.7,26.9) InCinema 1.8 (1.3,2.7) 1.9 (1.3,2.8) 0.9 (0.3,3.4) 3.3 (1.6,6.6) 1.6 (1.1,2.4) OnInternet 8.0 (5.8,11.0) 8.3 (5.9,11.4) 1.6 (0.6,4.3) 17.8 (9.2,31.7) 6.4 (4.5,9.0) OnPublicTransportation 21.0 (16.5,26.3) 21.4 (16.8,26.8) 11.9 (6.4,21.1) 18.4 (12.0,27.1) 21.4 (17.0,26.6) SomewhereElse 2.4 (1.6,3.5) 2.5 (1.7,3.6) 0.6 (0.2,2.0) 3.3 (1.3,7.9) 2.2 (1.5,3.3) AnyLocation 63.0 (57.3,68.3) 63.8 (58.0,69.2) 43.7 (31.8,56.5) 62.5 (49.5,74.0) 63.0 (57.7,68.1) Nonsmokers InNewspapersorinMagazines 21.6 (18.9,24.6) 26.8 (23.0,31.0) 19.0 (16.2,22.1) 25.0 (21.0,29.5) 20.5 (17.6,23.7) OnTelevisionortheRadio 45.8 (41.7,49.9) 48.8 (44.1,53.6) 44.3 (40.0,48.6) 49.1 (43.9,54.4) 44.7 (40.5,48.9) OnTelevision 44.8 (40.8,48.9) 47.5 (42.7,52.3) 43.5 (39.2,47.8) 48.4 (43.2,53.6) 43.6 (39.5,47.9) OntheRadio 6.0 (4.4,7.9) 7.6 (5.6,10.1) 5.1 (3.7,7.1) 5.1 (3.0,8.6) 6.2 (4.7,8.2) OnBillboards 20.5 (17.5,23.9) 24.0 (19.7,29.0) 18.7 (15.9,21.9) 22.8 (18.1,28.2) 19.7 (16.8,23.0) OnPoster 11.0 (8.6,14.1) 12.8 (9.7,16.6) 10.2 (7.8,13.1) 13.9 (10.6,18.1) 10.1 (7.7,13.2) OnPublicWalls 18.2 (15.0,21.8) 22.7 (18.6,27.5) 15.9 (13.0,19.2) 18.9 (14.6,24.0) 17.9 (14.8,21.5) InCinema 2.5 (1.7,3.6) 3.7 (2.2,6.1) 1.9 (1.4,2.6) 5.7 (3.3,9.5) 1.5 (1.1,2.1) OnInternet 8.1 (6.5,10.0) 11.0 (8.4,14.2) 6.6 (5.3,8.2) 16.2 (11.9,21.6) 5.5 (4.3,6.9) OnPublicTransportation 20.0 (16.6,23.8) 23.3 (19.4,27.8) 18.3 (15.0,22.2) 25.0 (19.7,31.2) 18.4 (15.2,22.0) SomewhereElse 2.8 (2.0,3.9) 4.1 (2.7,6.1) 2.1 (1.4,3.1) 3.5 (2.2,5.4) 2.6 (1.8,3.6) AnyLocation 58.5 (54.0,62.9) 63.5 (58.0,68.6) 56.0 (51.3,60.7) 65.8 (58.7,72.3) 56.2 (51.6,60.6) *Estimatebasedonlessthan25unweightedcase. 181
208 Places Table8.1(cont.):Percentageofadults15yearsoldwhonoticedanticigarettesmokinginformation duringthelast30daysinvariousplaces,bysmokingstatusandselecteddemographiccharacteristics GATSChina,2010. Overall Residence Region Urban Rural East Central West Percentage(95%CI) Overall InNewspapersorinMagazines 21.8 (18.9,24.9) 30.3 (26.1,34.9) 14.5 (10.9,18.9) 24.9 (20.1,30.5) 18.8 (13.3,25.9) 20.5 (16.1,25.6) OnTelevisionortheRadio 46.4 (42.0,50.8) 50.4 (44.7,56.1) 42.9 (36.6,49.5) 44.7 (37.4,52.3) 48.5 (41.1,56.0) 46.5 (39.0,54.2) OnTelevision 45.4 (41.1,49.8) 49.2 (43.6,54.9) 42.1 (35.7,48.6) 43.6 (36.3,51.2) 47.5 (40.2,54.9) 45.6 (38.2,53.3) OntheRadio 6.0 (4.5,8.0) 7.0 (5.2,9.4) 5.2 (3.0,8.8) 6.7 (4.6,9.8) 4.8 (3.2,7.1) 6.2 (3.2,11.7) OnBillboards 20.5 (17.4,24.1) 30.2 (25.4,35.6) 12.2 (8.6,17.0) 22.8 (18.0,28.4) 18.5 (12.6,26.3) 19.6 (13.9,26.9) OnPoster 10.6 (8.2,13.7) 17.8 (13.5,23.2) 4.5 (3.2,6.3) 13.0 (8.7,18.8) 7.7 (4.0,14.2) 10.4 (6.9,15.4) OnPublicWalls 18.8 (15.4,22.8) 28.8 (23.6,34.7) 10.3 (7.0,15.0) 21.5 (16.4,27.8) 16.8 (10.1,26.7) 17.4 (12.0,24.6) InCinema 2.3 (1.7,3.2) 3.8 (2.7,5.4) 1.0 (0.4,2.5) 3.2 (1.9,5.5) 1.3 (0.7,2.4) 2.1 (1.4,3.1) OnInternet 8.1 (6.5,9.9) 11.8 (9.7,14.1) 4.9 (3.3,7.3) 11.1 (8.0,15.1) 5.6 (4.0,7.9) 6.6 (4.6,9.4) OnPublicTransportation 20.3 (16.8,24.3) 26.8 (20.8,33.8) 14.7 (11.2,19.1) 18.7 (14.4,23.8) 21.9 (13.7,33.1) 20.8 (15.5,27.3) SomewhereElse 2.7 (1.9,3.7) 4.1 (2.9,5.9) 1.4 (0.8,2.5) 2.7 (1.6,4.5) 3.5 (2.0,5.8) 2.1 (1.1,3.7) AnyLocation 59.8 (55.1,64.3) 69.0 (62.7,74.7) 51.9 (45.3,58.4) 59.5 (51.8,66.8) 60.9 (51.8,69.4) 59.1 (50.8,67.0) Currentsmokers InNewspapersorinMagazines 22.1 (18.4,26.4) 30.9 (24.6,38.1) 15.6 (11.3,21.1) 25.5 (18.8,33.6) 18.0 (12.1,25.9) 21.9 (15.7,29.6) OnTelevisionortheRadio 47.8 (42.0,53.7) 51.7 (43.0,60.4) 44.9 (37.4,52.6) 46.1 (35.7,56.9) 51.5 (43.0,59.9) 46.7 (37.2,56.4) OnTelevision 46.8 (41.1,52.7) 50.3 (41.7,58.8) 44.3 (36.9,51.9) 44.6 (34.5,55.2) 50.5 (42.1,58.8) 46.3 (36.9,56.0) OntheRadio 6.2 (4.2,9.0) 7.9 (5.1,12.0) 4.9 (2.4,9.6) 6.7 (4.0,11.0) 6.9 (4.1,11.2) 5.1 (1.9,13.3) OnBillboards 20.6 (16.6,25.3) 29.4 (22.8,37.0) 14.0 (9.8,19.7) 22.8 (17.3,29.4) 20.1 (12.8,30.2) 18.9 (12.0,28.4) OnPoster 9.6 (7.0,13.1) 16.7 (11.9,23.1) 4.3 (2.8,6.5) 10.6 (6.3,17.2) 6.8 (3.5,12.8) 10.8 (6.2,17.9) OnPublicWalls 20.6 (15.7,26.5) 29.8 (21.9,39.2) 13.7 (8.5,21.2) 21.8 (15.7,29.3) 19.9 (10.5,34.4) 19.9 (11.9,31.5) InCinema 1.8 (1.3,2.7) 3.6 (2.4,5.3) 0.5 (0.2,1.3) 2.0 (1.1,3.8) 1.6 (0.8,3.2) 1.8 (0.9,3.7) OnInternet 8.0 (5.8,11.0) 13.5 (9.8,18.2) 3.9 (2.3,6.6) 12.0 (7.4,19.0) 3.9 (2.0,7.6) 7.0 (4.3,11.2) OnPublicTransportation 21.0 (16.5,26.3) 26.5 (19.3,35.1) 16.9 (12.2,22.9) 18.5 (13.7,24.5) 23.1 (13.5,36.7) 21.9 (14.8,31.2) SomewhereElse 2.4 (1.6,3.5) 3.3 (2.0,5.4) 1.7 (1.0,3.0) 2.2 (1.3,4.0) 2.6 (1.2,5.8) 2.3 (1.2,4.5) AnyLocation 63.0 (57.3,68.3) 72.8 (66.3,78.4) 55.6 (47.9,63.1) 64.1 (55.5,71.9) 63.3 (52.7,72.8) 61.5 (50.8,71.3) Nonsmokers InNewspapersorinMagazines 21.6 (18.9,24.6) 30.1 (26.1,34.4) 14.0 (10.6,18.3) 24.7 (20.1,30.0) 19.1 (13.5,26.3) 19.9 (15.9,24.5) OnTelevisionortheRadio 45.8 (41.7,49.9) 49.9 (44.7,55.2) 42.1 (35.8,48.5) 44.2 (37.4,51.2) 47.3 (40.0,54.7) 46.4 (39.4,53.7) OnTelevision 44.8 (40.8,48.9) 48.9 (43.7,54.1) 41.1 (34.9,47.6) 43.3 (36.5,50.3) 46.4 (39.2,53.7) 45.3 (38.3,52.6) OntheRadio 6.0 (4.4,7.9) 6.7 (4.9,9.0) 5.3 (3.1,9.0) 6.7 (4.6,9.7) 3.9 (2.6,5.9) 6.7 (3.6,12.2) OnBillboards 20.5 (17.5,23.9) 30.5 (26.1,35.4) 11.4 (8.0,16.1) 22.8 (17.9,28.5) 17.8 (12.3,25.0) 19.9 (14.6,26.6) OnPoster 11.0 (8.6,14.1) 18.2 (14.0,23.4) 4.6 (3.1,6.7) 13.8 (9.5,19.6) 8.0 (4.1,15.0) 10.2 (7.0,14.7) OnPublicWalls 18.2 (15.0,21.8) 28.5 (23.8,33.6) 8.9 (6.1,12.7) 21.5 (16.1,28.0) 15.6 (9.8,23.8) 16.3 (11.8,22.1) InCinema 2.5 (1.7,3.6) 3.9 (2.7,5.7) 1.2 (0.5,3.1) 3.6 (2.0,6.4) 1.2 (0.7,2.4) 2.2 (1.5,3.2) OnInternet 8.1 (6.5,10.0) 11.2 (9.0,13.8) 5.3 (3.5,8.1) 10.7 (7.5,15.1) 6.3 (4.5,8.8) 6.4 (4.6,8.9) OnPublicTransportation 20.0 (16.6,23.8) 27.0 (20.9,34.0) 13.7 (10.4,17.9) 18.7 (14.2,24.3) 21.4 (13.8,31.8) 20.4 (15.4,26.4) SomewhereElse 2.8 (2.0,3.9) 4.5 (3.1,6.4) 1.3 (0.6,2.5) 2.8 (1.6,4.9) 3.8 (2.3,6.2) 1.9 (1.0,3.7) AnyLocation 58.5 (54.0,62.9) 67.7 (61.2,73.6) 50.3 (43.7,56.8) 57.9 (50.1,65.3) 60.0 (51.1,68.2) 58.1 (50.1,65.7) *Estimatebasedonlessthan25unweightedcase. 182
209 Places Table8.1(cont.):Percentageofadults15yearsoldwhonoticedanticigarettesmokinginformation duringthelast30daysinvariousplaces,bysmokingstatusandselecteddemographiccharacteristics GATSChina,2010. Overall PrimarySchoolor Less AttendedSecondary School Education 1 HighSchool Graduate CollegeGraduateor Above Percentage(95%CI) Overall InNewspapersorinMagazines 21.8 (18.9,24.9) 6.7 (5.4,8.4) 20.5 (17.1,24.5) 33.4 (29.5,37.6) 44.5 (38.6,50.6) OnTelevisionortheRadio 46.4 (42.0,50.8) 35.7 (31.0,40.6) 49.9 (44.3,55.4) 52.2 (46.8,57.5) 53.8 (46.7,60.8) OnTelevision 45.4 (41.1,49.8) 34.9 (30.3,39.7) 49.0 (43.4,54.6) 51.1 (45.8,56.3) 51.7 (44.6,58.7) OntheRadio 6.0 (4.5,8.0) 4.2 (2.7,6.7) 6.1 (4.2,8.9) 7.9 (6.2,9.9) 10.8 (7.1,16.1) OnBillboards 20.5 (17.4,24.1) 7.3 (5.9,8.9) 21.1 (17.1,25.8) 29.2 (24.4,34.5) 39.6 (32.7,46.8) OnPoster 10.6 (8.2,13.7) 3.1 (2.2,4.2) 8.2 (6.3,10.6) 15.0 (10.8,20.5) 25.8 (19.4,33.5) OnPublicWalls 18.8 (15.4,22.8) 5.8 (4.2,7.8) 19.6 (15.4,24.6) 26.0 (21.0,31.8) 42.0 (34.4,49.9) InCinema 2.3 (1.7,3.2) 0.1 (0.0,0.3) 0.6 (0.3,1.1) 2.3 (1.5,3.7) 7.3 (5.1,10.2) OnInternet 8.1 (6.5,9.9) 0.2 (0.1,0.4) 3.2 (2.3,4.3) 9.3 (7.3,11.9) 24.3 (20.4,28.7) OnPublicTransportation 20.3 (16.8,24.3) 8.0 (6.1,10.4) 20.4 (16.6,24.9) 26.5 (22.1,31.4) 36.6 (28.5,45.5) SomewhereElse 2.7 (1.9,3.7) 0.7 (0.4,1.2) 2.5 (1.6,3.9) 3.8 (2.7,5.4) 5.2 (3.3,7.9) AnyLocation 59.8 (55.1,64.3) 40.6 (35.7,45.6) 61.3 (55.8,66.5) 71.1 (66.6,75.3) 78.8 (73.1,83.6) Currentsmokers InNewspapersorinMagazines 22.1 (18.4,26.4) 8.0 (6.0,10.6) 20.3 (15.5,26.2) 35.6 (30.0,41.7) 43.0 (34.4,52.1) OnTelevisionortheRadio 47.8 (42.0,53.7) 41.5 (36.2,47.0) 49.4 (42.4,56.4) 55.2 (47.6,62.6) 54.1 (43.1,64.7) OnTelevision 46.8 (41.1,52.7) 41.0 (35.8,46.5) 48.4 (41.6,55.4) 54.2 (46.7,61.5) 51.9 (40.6,63.1) OntheRadio 6.2 (4.2,9.0) 3.5 (2.2,5.4) 7.0 (3.6,13.0) 8.0 (4.8,12.9) 11.1 (6.5,18.4) OnBillboards 20.6 (16.6,25.3) 7.8 (5.8,10.3) 20.4 (14.9,27.2) 30.2 (23.6,37.8) 40.5 (31.2,50.6) OnPoster 9.6 (7.0,13.1) 2.7 (1.6,4.5) 7.6 (5.5,10.4) 13.6 (8.5,21.1) 23.3 (15.3,33.9) OnPublicWalls 20.6 (15.7,26.5) 6.5 (4.6,9.1) 21.3 (13.9,31.0) 26.7 (19.2,35.8) 43.5 (33.4,54.2) InCinema 1.8 (1.3,2.7) 0.1 (0.0,0.4) 0.9 (0.3,2.3) 1.5 (0.8,2.8) 9.1 (5.7,14.0) OnInternet 8.0 (5.8,11.0) 0.0 (0.0,0.1) 4.1 (2.4,6.7) 10.4 (7.0,15.2) 25.2 (18.1,33.9) OnPublicTransportation 21.0 (16.5,26.3) 10.0 (7.3,13.5) 22.4 (16.7,29.5) 27.2 (20.6,35.0) 34.9 (24.8,46.5) SomewhereElse 2.4 (1.6,3.5) 0.8 (0.3,1.7) 2.5 (1.5,4.0) 3.2 (1.7,5.6) 3.1 (1.4,6.6) AnyLocation 63.0 (57.3,68.3) 47.5 (42.2,52.9) 62.2 (55.0,68.8) 75.0 (69.1,80.1) 82.4 (75.9,87.5) Nonsmokers InNewspapersorinMagazines 21.6 (18.9,24.6) 6.3 (4.9,8.1) 20.6 (17.5,24.1) 32.2 (27.6,37.2) 45.0 (39.2,51.0) OnTelevisionortheRadio 45.8 (41.7,49.9) 33.8 (28.8,39.1) 50.2 (44.8,55.5) 50.5 (44.7,56.3) 53.7 (47.1,60.1) OnTelevision 44.8 (40.8,48.9) 32.8 (28.0,38.1) 49.3 (43.9,54.8) 49.4 (43.6,55.2) 51.6 (45.2,58.0) OntheRadio 6.0 (4.4,7.9) 4.5 (2.7,7.5) 5.6 (4.2,7.5) 7.8 (5.8,10.5) 10.7 (6.9,16.1) OnBillboards 20.5 (17.5,23.9) 7.1 (5.6,9.1) 21.5 (18.0,25.6) 28.6 (23.1,34.9) 39.2 (32.6,46.3) OnPoster 11.0 (8.6,14.1) 3.2 (2.1,4.7) 8.6 (6.5,11.1) 15.7 (11.7,20.8) 26.7 (19.8,35.0) OnPublicWalls 18.2 (15.0,21.8) 5.5 (3.8,8.0) 18.7 (15.5,22.3) 25.7 (20.7,31.3) 41.4 (34.2,49.0) InCinema 2.5 (1.7,3.6) 0.1 (0.0,0.4) 0.4 (0.2,0.8) 2.8 (1.6,4.9) 6.6 (4.4,9.8) OnInternet 8.1 (6.5,10.0) 0.2 (0.1,0.5) 2.7 (1.8,3.9) 8.7 (6.7,11.4) 24.0 (19.8,28.8) OnPublicTransportation 20.0 (16.6,23.8) 7.4 (5.4,10.0) 19.3 (15.9,23.2) 26.2 (21.6,31.3) 37.1 (29.0,46.1) SomewhereElse 2.8 (2.0,3.9) 0.7 (0.4,1.3) 2.5 (1.5,4.2) 4.2 (2.8,6.3) 5.9 (3.9,8.9) AnyLocation 58.5 (54.0,62.9) 38.3 (33.0,43.8) 60.9 (55.6,65.9) 69.1 (63.6,74.0) 77.5 (71.7,82.4) 1 Educationlevelisreportedonlyamongrespondents25+yearsold. *Estimatebasedonlessthan25unweightedcase. 183
210 Table8.2:Percentageofcurrentsmokers15yearsoldwhonoticedhealthwarningsoncigarette packagesandconsideredquittingbecauseofthewarninglabelsduringthelast30days,byselected demographiccharacteristics GATSChina,2010. Demographic Characteristics CurrentSmokers 1 WhoNoticed HealthWarningsonCigarette Package 2 ThoughtAboutQuittingBecauseof WarningLabelAmongCurrentSmokers WhoNoticedWarningLabel 2 Percentage(95%CI) N Percentage(95%CI) N Overall 86.7 (82.1,90.2) 4, (31.5,41.6) 3,276 Gender Male 88.2 (83.5,91.7) 3, (31.2,41.6) 3,162 Female 51.6 (38.6,64.5) (31.4,52.4) 114 Age(years) (73.7,97.6) (26.0,52.0) (87.0,95.0) 1, (30.1,40.1) 1, (80.5,88.5) 1, (31.6,43.4) 1, (48.9,65.3) (29.5,48.2) 326 Residence Urban 94.1 (91.1,96.1) 1, (25.2,40.1) 1,396 Rural 81.1 (74.4,86.4) 2, (33.9,46.5) 1,880 EducationLevel 3 PrimarySchoolorLess 66.1 (60.6,71.2) 1, (32.0,42.8) 855 AttendedSecondarySchool 90.3 (84.0,94.3) 1, (35.5,46.9) 1,344 HighSchoolGraduate 96.0 (92.6,97.8) (22.8,36.2) 593 CollegeGraduateorAbove 98.4 (95.1,99.5) (22.3,37.2) 320 Occupation AgricultureWorker 77.6 (69.1,84.3) 1, (33.8,47.5) 1,269 MachineOperator 91.3 (83.6,95.6) (28.3,44.3) 541 BusinessorServiceEmployee 95.6 (92.5,97.4) (28.8,46.3) 485 LeadersofOrganizations 92.4 (78.3,97.6) (18.3,40.7) 234 Clerks 97.3 (87.6,99.5) (24.7,59.5) 80 SpecializedTechnicians 96.9 (93.5,98.5) (22.2,43.0) 169 Medical/HealthPersonnel 96.9 (84.3,99.4) (22.7,76.8) 25 TeachingStaff (,) (11.4,37.8) 40 Soldiers (,)* (6.3,89.9)* 4 Students (,)* (2.6,57.4)* 9 NoJobs 77.2 (68.0,84.4) (18.4,42.0) 156 Retired 83.4 (72.0,90.7) (27.0,47.8) 236 Others 91.0 (70.4,97.7) (5.3,39.0) 27 Region East 89.4 (82.6,93.7) 1, (24.2,39.4) 1,042 Central 88.9 (84.1,92.4) 1, (30.4,42.1) 1,000 West 82.3 (71.5,89.6) 1, (32.4,52.7) 1,234 1 Includesdailyandoccasional(lessthandaily)smokers. 2 Duringthelast30days. 3 Educationlevelisreportedonlyamongrespondents25+yearsold. *Estimatebasedonlessthan25unweightedcase. 184
211 Table8.3:Percentageofadults15yearsoldwhobelievethatsmokingcausesseriousillness,stroke, heartattack,orlungcancer,bysmokingstatusandselecteddemographiccharacteristics GATSChina, Demographic Characteristics AdultsWhoBelieveThatSmokingCauses SeriousIllness Stroke HeartAttack LungCancer AllThreeDiseases Percentage(95%CI) Overall 81.8 (78.6,84.6) 27.2 (23.8,30.9) 38.7 (35.3,42.2) 77.5 (73.9,80.8) 23.2 (20.0,26.6) Gender Male 83.3 (80.1,86.1) 28.2 (24.7,32.0) 40.6 (36.9,44.4) 79.0 (75.2,82.3) 24.4 (21.0,28.2) Female 80.3 (76.7,83.4) 26.2 (22.5,30.1) 36.7 (33.3,40.2) 76.0 (72.1,79.5) 21.9 (18.8,25.3) Age(years) (85.3,92.5) 27.3 (22.0,33.3) 41.1 (36.2,46.1) 86.0 (81.6,89.5) 22.1 (17.2,27.9) (81.3,87.5) 26.9 (22.8,31.5) 38.1 (34.4,41.9) 80.9 (77.0,84.3) 22.3 (18.6,26.4) (74.1,81.1) 28.5 (24.8,32.4) 39.2 (35.3,43.3) 72.9 (68.4,76.9) 25.6 (22.1,29.5) (60.0,70.7) 24.1 (20.1,28.7) 34.0 (29.1,39.2) 59.1 (53.0,65.0) 21.9 (18.4,25.8) Residence Urban 90.4 (88.2,92.1) 33.8 (29.1,38.7) 47.5 (43.3,51.8) 87.6 (85.5,89.5) 29.2 (24.8,34.0) Rural 74.5 (70.2,78.4) 21.6 (17.3,26.5) 31.1 (26.9,35.6) 68.9 (63.7,73.6) 17.9 (13.9,22.6) EducationLevel 1 PrimarySchoolorLess 63.8 (59.1,68.3) 18.1 (14.6,22.2) 26.5 (22.6,30.8) 58.1 (52.8,63.3) 15.7 (12.4,19.7) AttendedSecondarySchool 84.1 (81.2,86.7) 25.7 (22.3,29.5) 37.1 (33.3,41.1) 78.7 (75.0,82.0) 21.5 (18.1,25.4) HighSchoolGraduate 90.0 (87.3,92.1) 33.3 (28.8,38.2) 47.6 (43.7,51.5) 87.1 (84.2,89.5) 28.9 (24.8,33.4) CollegeGraduateorAbove 95.2 (91.9,97.1) 47.8 (41.0,54.6) 58.2 (51.0,65.1) 94.0 (91.7,95.6) 41.6 (35.2,48.2) Occupation AgricultureWorker 70.6 (65.4,75.4) 19.4 (14.4,25.6) 27.9 (22.8,33.6) 62.9 (56.3,68.9) 16.1 (11.2,22.6) MachineOperator 85.2 (79.7,89.3) 26.5 (22.7,30.7) 38.7 (31.9,45.9) 83.9 (80.1,87.1) 20.8 (17.1,25.1) BusinessorService Employee 87.3 (84.0,90.0) 25.4 (20.1,31.5) 36.1 (30.7,41.8) 84.6 (80.8,87.7) 20.3 (15.0,26.9) LeadersofOrganizations 91.9 (86.7,95.1) 43.4 (36.4,50.6) 54.9 (48.4,61.2) 89.6 (84.1,93.3) 39.2 (33.5,45.3) Clerks 93.5 (87.8,96.7) 38.1 (28.4,49.0) 53.0 (42.7,63.0) 93.2 (87.4,96.4) 33.3 (25.8,41.8) SpecializedTechnicians 91.4 (85.2,95.1) 37.5 (30.4,45.1) 51.7 (42.7,60.5) 88.0 (82.9,91.8) 33.0 (26.1,40.8) Medical/HealthPersonnel 97.5 (87.9,99.5) 60.1 (48.7,70.5) 75.9 (65.7,83.8) 98.6 (96.1,99.5) 55.8 (44.6,66.5) TeachingStaff 97.9 (93.1,99.4) 44.9 (35.5,54.6) 50.5 (37.6,63.4) 94.4 (87.1,97.7) 34.7 (24.2,46.9) Soldiers (,)* 22.6 (5.9,57.8)* 59.1 (21.5,88.4)* (,)* 22.6 (5.9,57.8)* Students 95.2 (90.2,97.7) 32.7 (24.7,41.9) 52.3 (42.7,61.7) 93.9 (87.1,97.2) 28.7 (21.4,37.3) NoJobs 78.0 (73.6,81.8) 19.6 (14.8,25.5) 33.4 (29.0,38.1) 72.3 (68.3,76.0) 15.7 (11.6,20.9) Retired 84.2 (76.6,89.7) 36.9 (30.6,43.7) 49.3 (42.7,56.0) 82.0 (73.2,88.3) 34.2 (28.4,40.5) Others 80.4 (64.3,90.4) 40.4 (17.3,68.7) 45.7 (30.1,62.2) 71.1 (56.5,82.3) 34.2 (17.3,56.4) Region East 83.3 (77.3,88.0) 29.7 (24.6,35.4) 42.1 (37.0,47.4) 80.9 (75.9,85.1) 25.6 (20.5,31.4) Central 82.4 (75.9,87.4) 25.5 (19.0,33.5) 37.5 (30.4,45.2) 73.9 (66.0,80.6) 21.7 (16.5,27.9) West 79.6 (74.4,84.0) 25.6 (19.4,32.9) 35.6 (29.8,41.9) 76.5 (69.3,82.4) 21.6 (15.7,28.8) 1 Educationlevelisreportedonlyamongrespondents25+yearsold. *Estimatebasedonlessthan25unweightedcases. 185
212 Table8.3(cont.):Percentageofadults15yearsoldwhobelievethatsmokingcausesseriousillness, stroke,heartattack,orlungcancer,bysmokingstatusandselecteddemographiccharacteristics GATS China,2009. Demographic Characteristics AdultsWhoBelieveThatSmokingCauses SeriousIllness Stroke HeartAttack LungCancer AllThreeDiseases Percentage(95%CI) Smoker 79.6 (76.2,82.6) 24.5 (21.0,28.4) 34.8 (31.0,38.9) 74.3 (70.2,78.0) 21.2 (17.8,25.1) Gender Male 80.4 (77.0,83.3) 24.6 (21.0,28.6) 35.3 (31.2,39.5) 75.2 (71.0,79.0) 21.3 (17.8,25.3) Female 62.9 (50.6,73.7) 21.8 (15.3,30.1) 24.6 (16.3,35.3) 53.7 (43.4,63.8) 19.7 (11.9,30.8) Age(years) (80.4,92.6) 21.3 (14.5,30.1) 34.6 (25.7,44.7) 85.0 (75.7,91.2) 17.6 (11.1,26.9) (79.4,86.9) 22.9 (18.1,28.6) 34.8 (30.0,39.9) 79.1 (74.7,83.0) 19.4 (15.2,24.4) (72.0,79.7) 28.9 (25.0,33.1) 37.2 (32.7,41.9) 69.1 (64.1,73.8) 26.0 (22.0,30.5) (53.5,66.4) 19.5 (14.2,26.1) 25.1 (18.9,32.5) 51.5 (42.6,60.3) 17.3 (12.5,23.6) Residence Urban 87.5 (84.1,90.2) 30.7 (24.8,37.3) 44.6 (39.8,49.6) 83.9 (80.5,86.7) 27.1 (21.5,33.6) Rural 73.8 (69.7,77.5) 19.9 (15.8,24.6) 27.5 (22.9,32.7) 67.1 (61.5,72.3) 16.8 (12.7,21.8) EducationLevel 1 PrimarySchoolorLess 62.5 (57.4,67.4) 17.4 (13.7,21.8) 22.0 (18.2,26.3) 53.1 (46.7,59.5) 14.6 (11.2,18.9) AttendedSecondarySchool 79.9 (75.6,83.6) 23.4 (19.5,27.9) 32.2 (28.0,36.6) 75.7 (71.4,79.5) 19.5 (15.7,24.0) HighSchoolGraduate 87.2 (80.9,91.7) 30.4 (25.1,36.2) 46.2 (39.5,53.0) 81.9 (75.9,86.7) 27.5 (22.5,33.2) CollegeGraduateorAbove 94.6 (90.7,96.9) 40.5 (29.7,52.2) 56.3 (45.8,66.3) 90.9 (86.5,94.0) 36.7 (27.1,47.5) Occupation AgricultureWorker 71.8 (65.4,77.4) 18.3 (12.6,25.7) 25.5 (19.7,32.2) 62.2 (54.0,69.7) 15.3 (9.7,23.3) MachineOperator 82.3 (75.9,87.2) 25.5 (20.3,31.5) 35.7 (26.6,46.0) 81.6 (76.2,85.9) 20.3 (14.9,27.1) BusinessorService Employee 85.6 (79.6,90.1) 21.9 (15.3,30.3) 33.7 (26.1,42.2) 81.8 (75.3,87.0) 20.0 (13.2,29.2) LeadersofOrganizations 89.2 (81.2,94.0) 40.5 (29.4,52.6) 47.8 (38.3,57.4) 83.2 (71.0,90.9) 36.7 (28.5,45.8) Clerks 88.3 (78.0,94.1) 45.1 (32.2,58.6) 65.6 (51.9,77.2) 88.0 (77.0,94.1) 46.2 (32.3,60.7) SpecializedTechnicians 88.3 (77.7,94.3) 25.9 (17.8,36.1) 51.8 (37.5,65.8) 86.5 (75.4,93.1) 23.9 (15.7,34.8) Medical/HealthPersonnel (,) 72.3 (42.4,90.3) 78.3 (41.4,94.9) (,) 56.1 (28.1,80.7) TeachingStaff 96.8 (86.9,99.3) 52.0 (29.4,73.9) 65.3 (41.0,83.6) 96.8 (86.9,99.3) 45.9 (20.5,73.7) Soldiers (,)* 13.8 (1.4,64.2)* 54.8 (9.5,93.3)* (,)* 13.8 (1.4,64.2)* Students 87.6 (44.7,98.4)* 29.2 (5.5,74.4)* 61.8 (23.4,89.5)* (,)* 29.0 (5.5,74.4)* NoJobs 76.5 (67.6,83.6) 21.1 (14.0,30.4) 28.5 (21.0,37.4) 71.7 (60.3,80.8) 17.5 (10.2,28.4) Retired 72.6 (63.9,79.9) 26.4 (18.5,36.2) 37.7 (30.1,45.8) 64.8 (51.7,76.0) 25.0 (17.4,34.4) Others 92.3 (75.8,97.9) 39.1 (12.5,74.3) 50.9 (39.0,62.8) 87.8 (70.6,95.6) 24.4 (11.4,44.7) Region East 80.4 (73.4,85.9) 26.8 (21.2,33.2) 39.5 (33.1,46.4) 76.8 (70.8,81.9) 23.3 (17.3,30.6) Central 79.6 (73.2,84.8) 24.8 (18.1,32.8) 33.5 (26.9,40.7) 70.9 (63.7,77.2) 20.5 (15.7,26.3) West 78.9 (74.0,83.1) 22.0 (15.8,29.7) 31.1 (24.7,38.4) 74.3 (65.9,81.1) 19.8 (13.5,27.9) 1 Educationlevelisreportedonlyamongrespondents25+yearsold. *Estimatebasedonlessthan25unweightedcases. 186
213 Table8.3(cont.):Percentageofadults15yearsoldwhobelievethatsmokingcausesseriousillness, stroke,heartattack,orlungcancer,bysmokingstatusandselecteddemographiccharacteristics GATS China,2009. Demographic Characteristics AdultsWhoBelieveThatSmokingCauses SeriousIllness Stroke HeartAttack LungCancer AllThreeDiseases Percentage(95%CI) NonSmoker 82.7 (79.3,85.6) 28.2 (24.5,32.3) 40.2 (36.7,43.8) 78.8 (75.0,82.1) 23.9 (20.6,27.5) Gender Male 86.7 (82.8,89.7) 32.2 (27.8,36.9) 46.6 (42.5,50.7) 83.3 (79.3,86.6) 27.7 (23.7,32.2) Female 80.7 (77.2,83.8) 26.3 (22.6,30.3) 36.9 (33.5,40.6) 76.5 (72.6,80.1) 21.9 (18.8,25.4) Age(years) (84.7,93.3) 28.6 (22.8,35.2) 42.5 (37.1,48.2) 86.2 (81.3,90.0) 23.0 (17.8,29.2) (81.9,88.1) 28.7 (24.1,33.8) 39.6 (35.8,43.5) 81.7 (77.6,85.2) 23.6 (19.5,28.2) (74.7,82.2) 28.3 (24.3,32.7) 40.3 (36.0,44.7) 74.8 (70.3,78.8) 25.4 (21.6,29.6) (61.2,72.6) 25.5 (21.3,30.2) 36.6 (31.1,42.4) 61.4 (55.5,67.0) 23.1 (19.1,27.5) Residence Urban 91.4 (89.1,93.2) 34.9 (30.4,39.6) 48.5 (44.2,52.9) 89.0 (86.7,90.9) 29.9 (25.6,34.5) Rural 74.9 (70.1,79.1) 22.3 (17.5,28.0) 32.6 (28.1,37.6) 69.7 (64.2,74.6) 18.3 (14.0,23.6) EducationLevel 1 PrimarySchoolorLess 64.2 (59.3,68.9) 18.3 (14.4,23.1) 28.0 (23.6,32.9) 59.8 (54.4,64.9) 16.1 (12.2,20.9) AttendedSecondarySchool 86.5 (82.8,89.5) 27.0 (22.8,31.6) 39.9 (34.9,45.1) 80.4 (76.0,84.1) 22.6 (18.5,27.3) HighSchoolGraduate 91.4 (88.2,93.8) 34.9 (29.6,40.6) 48.4 (42.5,54.3) 89.9 (87.3,91.9) 29.6 (24.8,35.0) CollegeGraduateorAbove 95.4 (91.8,97.4) 50.4 (44.1,56.7) 58.9 (52.1,65.4) 95.1 (92.5,96.8) 43.3 (37.5,49.4) Occupation AgricultureWorker 70.1 (65.0,74.8) 19.9 (14.6,26.6) 29.0 (23.5,35.2) 63.2 (56.7,69.2) 16.5 (11.3,23.3) MachineOperator 88.2 (81.0,92.9) 27.6 (23.2,32.5) 41.8 (35.7,48.1) 86.3 (81.3,90.1) 21.3 (17.4,25.8) BusinessorService Employee 88.1 (84.5,90.9) 26.8 (21.1,33.4) 37.1 (31.6,42.9) 85.7 (82.0,88.7) 20.5 (15.1,27.1) LeadersofOrganizations 93.4 (85.5,97.2) 45.1 (37.5,52.8) 58.9 (50.3,67.0) 93.3 (87.0,96.6) 40.6 (32.2,49.5) Clerks 96.4 (86.3,99.1) 34.4 (23.5,47.2) 46.1 (34.0,58.7) 96.0 (87.0,98.8) 26.7 (18.1,37.6) SpecializedTechnicians 93.3 (85.4,97.1) 44.8 (37.1,52.9) 51.6 (42.5,60.6) 89.0 (82.4,93.3) 38.7 (30.7,47.3) Medical/HealthPersonnel 97.0 (85.2,99.4) 57.6 (45.8,68.6) 75.4 (62.5,84.9) 98.3 (95.3,99.4) 55.8 (43.9,67.0) TeachingStaff 98.1 (92.4,99.5) 43.7 (33.9,53.9) 48.0 (34.7,61.5) 94.0 (85.8,97.6) 32.8 (22.7,44.9) Soldiers (,)* 30.5 (5.8,75.6)* 63.0 (17.4,93.2)* (,)* 30.5 (5.8,75.6)* Students 95.3 (90.2,97.8) 32.8 (24.7,42.0) 52.2 (42.4,61.8) 93.8 (87.0,97.2) 28.7 (21.4,37.4) NoJobs 78.3 (73.1,82.7) 19.4 (14.3,25.8) 34.2 (29.2,39.6) 72.4 (68.5,76.0) 15.5 (11.2,21.0) Retired 86.8 (79.2,91.9) 39.3 (32.7,46.2) 52.0 (44.9,59.0) 85.9 (78.2,91.2) 36.0 (30.0,42.5) Others 73.0 (50.4,87.8) 41.2 (18.9,67.8) 42.4 (21.1,67.0) 60.6 (43.9,75.1) 40.4 (18.0,67.6) Region East 84.4 (78.2,89.0) 30.8 (25.3,36.8) 43.1 (37.9,48.3) 82.4 (77.2,86.6) 26.3 (21.1,32.3) Central 83.5 (76.5,88.8) 25.8 (19.1,33.9) 39.1 (31.4,47.4) 75.1 (66.3,82.3) 22.1 (16.7,28.7) West 79.9 (74.3,84.6) 27.2 (20.2,35.6) 37.5 (31.3,44.2) 77.5 (70.5,83.2) 22.3 (16.1,30.1) 1 Educationlevelisreportedonlyamongrespondents25+yearsold. *Estimatebasedonlessthan25unweightedcases. 187
214 Table8.4:Percentageofadults15yearsoldwhobelievethatbreathingsmokefromotherpeople s cigarettescausesseriousillness,heartdiseasesinadults,lungdiseaseinchildren,lungcancerinadults bysmokingstatusandselecteddemographiccharacteristics GATSChina,2010. AdultsWhoBelieveThatSmokingFromOtherPeople ssmokecauses Demographic Characteristics SeriousIllness HeartDiseasein Adults LungDiseasein Children LungCancer inadults AllThreeDiseases Percentage(95%CI) Overall 64.3 (60.5,67.9) 27.5 (24.1,31.1) 51.0 (47.2,54.8) 52.6 (48.4,56.7) 24.6 (21.4,28.1) Gender Male 65.3 (61.1,69.4) 28.9 (25.2,32.9) 51.8 (47.5,56.1) 54.1 (49.7,58.5) 25.8 (22.3,29.7) Female 63.2 (59.5,66.8) 26.0 (22.7,29.5) 50.1 (46.4,53.9) 51.0 (46.6,55.4) 23.4 (20.3,26.9) Age(years) (72.5,81.8) 31.4 (27.0,36.2) 61.3 (55.5,66.7) 66.5 (61.0,71.7) 28.1 (23.7,33.0) (64.3,72.2) 28.6 (25.0,32.6) 55.5 (51.2,59.7) 56.2 (51.7,60.6) 25.7 (22.1,29.8) (52.1,61.1) 25.2 (21.2,29.7) 43.8 (39.6,48.2) 44.7 (39.8,49.7) 22.8 (18.8,27.4) (36.7,47.2) 20.9 (16.7,25.7) 31.6 (26.7,37.0) 31.2 (26.0,36.9) 18.1 (14.1,22.9) Residence Urban 77.1 (74.1,79.8) 36.1 (31.9,40.5) 64.0 (59.8,68.0) 66.5 (62.6,70.1) 32.9 (28.6,37.5) Rural 53.4 (48.8,58.0) 20.1 (16.4,24.4) 39.9 (35.5,44.4) 40.8 (36.0,45.8) 17.6 (14.2,21.6) EducationLevel 1 PrimarySchoolorLess 38.8 (34.7,43.1) 14.8 (11.7,18.7) 27.4 (23.5,31.7) 26.4 (22.4,30.7) 12.5 (9.5,16.4) AttendedSecondarySchool 63.8 (60.0,67.4) 25.8 (21.8,30.2) 49.8 (46.0,53.7) 50.1 (46.2,54.1) 23.2 (19.1,27.8) HighSchoolGraduate 76.1 (72.7,79.2) 35.6 (31.4,40.1) 63.2 (58.3,67.9) 66.1 (62.2,69.7) 32.1 (27.9,36.8) CollegeGraduateorAbove 88.8 (86.2,91.0) 46.3 (40.5,52.3) 78.1 (73.7,81.9) 80.9 (77.0,84.2) 43.5 (37.8,49.4) Occupation AgricultureWorker 45.8 (40.4,51.3) 16.9 (12.2,22.8) 33.4 (28.1,39.1) 33.5 (27.7,39.8) 14.9 (10.4,20.8) MachineOperator 68.8 (62.1,74.8) 25.8 (20.4,32.1) 56.3 (50.9,61.6) 56.3 (49.2,63.2) 22.6 (18.8,27.0) BusinessorService Employee 72.0 (67.5,76.0) 27.5 (22.1,33.6) 53.9 (47.7,60.0) 60.0 (54.7,65.1) 24.3 (19.3,30.3) LeadersofOrganizations 80.6 (72.9,86.5) 40.6 (32.0,49.9) 69.0 (59.0,77.5) 72.0 (64.6,78.4) 38.8 (30.5,47.9) Clerks 78.6 (68.0,86.4) 37.5 (28.6,47.3) 67.0 (55.1,77.1) 71.7 (61.2,80.3) 29.5 (23.3,36.5) SpecializedTechnicians 77.1 (70.4,82.6) 34.7 (28.0,42.0) 63.0 (53.7,71.5) 66.4 (59.2,72.9) 30.6 (23.5,38.8) Medical/HealthPersonnel 88.7 (79.1,94.3) 66.0 (55.5,75.1) 85.2 (77.0,90.8) 80.1 (69.5,87.7) 62.3 (53.3,70.5) TeachingStaff 86.2 (81.0,90.2) 48.1 (37.8,58.5) 80.1 (73.4,85.4) 80.6 (75.0,85.2) 46.7 (36.4,57.4) Soldiers 99.8 (98.6,100.0)* 29.3 (8.0,66.3)* 99.8 (98.6,100.0)* 99.8 (98.6,100.0)* 29.3 (8.0,66.3)* Students 89.0 (83.2,93.0) 43.3 (36.3,50.6) 75.5 (69.2,80.9) 78.7 (68.3,86.3) 40.3 (34.6,46.3) NoJobs 61.6 (56.8,66.2) 24.0 (19.7,28.8) 47.5 (42.9,52.2) 47.9 (43.5,52.4) 20.6 (16.6,25.2) Retired 69.4 (60.3,77.2) 35.1 (28.5,42.3) 56.5 (48.2,64.5) 57.8 (48.7,66.3) 31.9 (25.2,39.4) Others 58.6 (37.6,76.8) 38.5 (19.6,61.6) 55.6 (34.2,75.1) 49.9 (27.4,72.4) 37.2 (17.9,61.7) Region East 68.6 (63.3,73.5) 30.9 (25.3,37.0) 56.1 (50.8,61.2) 57.3 (50.8,63.5) 27.1 (21.6,33.3) Central 62.8 (55.9,69.3) 24.6 (19.0,31.2) 47.8 (39.2,56.5) 48.4 (40.9,55.9) 22.1 (16.8,28.5) West 60.5 (52.3,68.2) 25.9 (20.2,32.5) 47.7 (40.4,55.1) 50.6 (42.5,58.8) 23.9 (18.4,30.3) 1 Educationlevelisreportedonlyamongrespondents25+yearsold. *Estimatebasedonlessthan25unweightedcases. 188
215 Table8.4(Cont.):Percentageofadults15yearsoldwhobelievethatbreathingsmokefromother people scigarettescausesseriousillness,heartdiseasesinadults,lungdiseaseinchildren,lungcancer inadultsbysmokingstatusandselecteddemographiccharacteristics GATSChina,2010. AdultsWhoBelieveThatSmokingFromOtherPeople ssmokecauses Demographic Characteristics SeriousIllness HeartDiseasein Adults LungDiseasein Children LungCancer inadults AllThreeDiseases Percentage(95%CI) CurrentSmoker 59.4 (54.9,63.9) 25.3 (20.6,30.7) 45.7 (41.4,50.1) 48.1 (43.2,53.0) 22.1 (17.9,27.0) Gender Male 60.3 (55.6,64.7) 25.6 (20.8,31.2) 46.3 (42.0,50.7) 48.7 (43.8,53.7) 22.4 (18.1,27.4) Female 40.5 (30.0,52.1) 17.6 (12.5,24.2) 31.9 (22.0,43.6) 33.0 (23.3,44.4) 15.8 (10.5,23.3) Age(years) (63.2,81.6) 27.5 (17.7,40.2) 54.4 (43.3,65.0) 61.7 (51.0,71.3) 22.0 (13.8,33.2) (60.9,70.2) 28.4 (22.9,34.6) 51.9 (46.5,57.3) 54.7 (49.4,59.8) 25.6 (20.1,31.9) (47.6,58.0) 22.6 (18.5,27.2) 40.0 (35.9,44.3) 40.1 (35.0,45.5) 19.6 (15.8,24.0) (23.7,38.1) 16.3 (11.4,22.8) 21.9 (16.1,29.0) 23.4 (17.5,30.5) 14.5 (9.8,20.9) Residence Urban 70.7 (66.3,74.7) 34.8 (27.9,42.4) 57.1 (51.5,62.5) 60.4 (54.6,65.9) 30.5 (24.3,37.4) Rural 51.0 (45.2,56.8) 18.2 (13.6,23.8) 37.2 (32.2,42.6) 38.9 (33.2,44.8) 15.9 (11.6,21.3) EducationLevel 1 PrimarySchoolorLess 34.1 (28.9,39.8) 14.4 (10.5,19.4) 23.6 (19.0,28.8) 24.2 (19.5,29.6) 12.5 (8.8,17.5) AttendedSecondarySchool 58.7 (54.9,62.4) 24.0 (19.6,29.0) 44.0 (40.2,47.9) 46.5 (41.6,51.5) 21.8 (17.5,26.8) HighSchoolGraduate 70.4 (64.4,75.7) 30.7 (24.2,38.2) 58.6 (52.2,64.7) 58.5 (52.1,64.6) 27.0 (20.8,34.1) CollegeGraduateorAbove 84.6 (78.9,89.0) 44.6 (34.7,55.0) 70.7 (61.8,78.2) 74.3 (64.7,82.0) 39.0 (28.1,51.0) Occupation AgricultureWorker 45.4 (37.4,53.7) 16.8 (10.8,25.4) 32.7 (26.2,40.0) 34.8 (26.2,44.6) 15.1 (9.4,23.4) MachineOperator 67.0 (58.3,74.7) 28.5 (18.5,41.2) 52.4 (45.6,59.1) 55.7 (46.1,64.9) 24.0 (17.4,32.1) BusinessorService Employee 69.3 (62.5,75.4) 27.4 (19.2,37.6) 55.1 (44.6,65.2) 57.9 (50.2,65.1) 25.4 (17.1,36.0) LeadersofOrganizations 73.7 (57.6,85.2) 35.1 (25.0,46.9) 58.4 (42.1,73.1) 64.1 (50.6,75.7) 32.5 (22.9,43.9) Clerks 71.8 (59.5,81.5) 45.4 (28.7,63.1) 47.0 (29.4,65.3) 59.9 (46.7,71.8) 27.1 (14.6,44.7) SpecializedTechnicians 67.0 (54.9,77.2) 34.3 (21.2,50.2) 54.1 (41.0,66.6) 53.8 (41.4,65.7) 32.5 (19.5,48.8) Medical/HealthPersonnel 86.9 (61.9,96.4) 63.2 (32.7,85.9) 81.8 (56.0,94.1) 46.9 (24.7,70.4) 43.3 (22.4,66.9) TeachingStaff 83.2 (64.4,93.1) 48.5 (22.5,75.3) 81.2 (61.6,92.1) 78.2 (59.0,89.9) 46.1 (20.6,73.7) Soldiers (,)* 16.4 (2.1,64.1)* (,)* (,)* 16.4 (2.1,64.1)* Students 51.5 (16.6,85.0)* 29.0 (5.5,74.4)* 51.3 (16.5,84.9)* 51.3 (16.5,84.9)* 29.0 (5.5,74.4)* NoJobs 62.7 (53.7,71.0) 22.4 (13.9,34.0) 44.9 (33.6,56.7) 47.8 (37.6,58.2) 18.4 (11.2,28.7) Retired 48.3 (34.0,62.9) 21.7 (15.3,29.8) 36.8 (27.1,47.7) 38.8 (27.6,51.3) 18.0 (11.9,26.2) Others 67.1 (44.6,83.7) 50.7 (24.0,76.9) 63.0 (39.9,81.3) 53.6 (26.6,78.6) 48.3 (21.5,76.0) Region East 62.4 (55.7,68.6) 29.7 (21.3,39.9) 49.3 (44.0,54.6) 51.5 (43.4,59.4) 25.4 (18.1,34.4) Central 57.8 (50.5,64.7) 22.0 (16.4,29.0) 44.6 (35.4,54.1) 44.2 (35.8,52.9) 19.1 (13.8,25.9) West 57.8 (48.2,66.8) 23.3 (15.6,33.4) 43.0 (34.8,51.7) 47.6 (38.7,56.7) 21.1 (13.9,30.7) 1 Educationlevelisreportedonlyamongrespondents25+yearsold. *Estimatebasedonlessthan25unweightedcases. 189
216 Table8.4(Cont.):Percentageofadults15yearsoldwhobelievethatbreathingsmokefromother people scigarettescausesseriousillness,heartdiseasesinadults,lungdiseaseinchildren,lungcancer inadultsbysmokingstatusandselecteddemographiccharacteristics GATSChina,2010. AdultsWhoBelieveThatSmokingFromOtherPeople ssmokecauses Demographic Characteristics SeriousIllness HeartDiseasein Adults LungDiseasein Children LungCancer inadults AllThreeDiseases Percentage(95%CI) NonSmoker 66.2 (62.5,69.7) 28.3 (25.2,31.7) 53.0 (49.1,56.9) 54.4 (50.1,58.5) 25.6 (22.6,28.9) Gender Male 71.1 (66.4,75.3) 32.6 (28.6,36.9) 58.0 (52.6,63.1) 60.2 (55.2,64.9) 29.6 (26.1,33.4) Female 63.8 (60.1,67.4) 26.2 (22.9,29.7) 50.6 (46.8,54.4) 51.5 (47.0,55.9) 23.6 (20.5,27.1) Age(years) (73.1,82.9) 32.3 (27.1,38.0) 62.8 (57.0,68.2) 67.6 (61.6,73.1) 29.4 (24.7,34.7) (65.4,73.5) 28.8 (25.3,32.5) 57.1 (52.8,61.3) 56.8 (52.1,61.4) 25.8 (22.4,29.5) (53.9,63.1) 26.5 (22.0,31.5) 45.7 (40.9,50.7) 47.0 (41.9,52.2) 24.4 (19.9,29.6) (39.9,50.6) 22.2 (17.9,27.1) 34.4 (29.1,40.2) 33.5 (28.0,39.6) 19.1 (15.0,24.1) Residence Urban 79.3 (76.2,82.2) 36.5 (32.5,40.8) 66.4 (62.0,70.5) 68.6 (64.6,72.4) 33.7 (29.6,38.1) Rural 54.4 (49.8,59.0) 20.9 (17.2,25.2) 41.0 (36.4,45.7) 41.6 (36.5,46.8) 18.3 (14.9,22.4) EducationLevel 1 PrimarySchoolorLess 40.4 (35.8,45.1) 15.0 (11.8,18.9) 28.7 (24.4,33.4) 27.1 (22.9,31.7) 12.5 (9.4,16.4) AttendedSecondarySchool 66.7 (61.9,71.1) 26.8 (22.5,31.6) 53.1 (48.5,57.7) 52.2 (47.9,56.4) 24.0 (19.6,29.1) HighSchoolGraduate 79.2 (75.8,82.2) 38.3 (33.5,43.2) 65.7 (59.8,71.2) 70.1 (65.6,74.3) 34.9 (29.9,40.3) CollegeGraduateorAbove 90.3 (87.8,92.4) 47.0 (41.2,52.8) 80.8 (76.5,84.5) 83.2 (80.0,86.1) 45.1 (39.8,50.6) Occupation AgricultureWorker 46.0 (40.7,51.3) 16.9 (12.4,22.5) 33.7 (28.2,39.6) 32.9 (27.6,38.6) 14.8 (10.5,20.5) MachineOperator 70.7 (64.2,76.5) 23.1 (19.8,26.8) 60.5 (53.9,66.6) 57.0 (50.5,63.3) 21.2 (18.2,24.5) BusinessorService Employee 73.1 (68.3,77.4) 27.5 (21.8,34.1) 53.4 (47.4,59.3) 60.9 (55.3,66.2) 23.9 (19.0,29.7) LeadersofOrganizations 84.5 (73.3,91.5) 43.8 (33.3,54.7) 75.0 (64.2,83.3) 76.5 (64.4,85.4) 42.4 (32.1,53.4) Clerks 82.4 (65.5,92.0) 33.2 (23.8,44.1) 78.0 (61.5,88.7) 78.1 (61.8,88.7) 30.8 (21.4,42.0) SpecializedTechnicians 83.5 (75.8,89.1) 34.9 (28.6,41.9) 68.7 (58.6,77.3) 74.4 (66.6,81.0) 29.5 (22.2,37.9) Medical/HealthPersonnel 89.1 (76.5,95.4) 66.5 (54.4,76.8) 85.9 (75.2,92.5) 86.8 (75.5,93.3) 66.1 (53.9,76.5) TeachingStaff 86.7 (80.4,91.2) 48.0 (38.0,58.1) 79.9 (72.1,85.8) 81.0 (74.5,86.2) 46.9 (36.8,57.2) Soldiers 99.7 (97.0,100.0)* 40.9 (8.2,84.3)* 99.7 (97.0,100.0)* 99.7 (97.0,100.0)* 40.9 (8.2,84.3)* Students 89.5 (83.7,93.4) 43.5 (36.4,50.8) 75.8 (69.5,81.2) 79.0 (68.5,86.7) 40.4 (34.7,46.5) NoJobs 61.4 (56.2,66.3) 24.2 (20.2,28.8) 48.0 (43.1,52.8) 47.9 (43.2,52.7) 20.9 (17.1,25.4) Retired 74.2 (66.3,80.7) 38.1 (31.1,45.7) 61.0 (52.9,68.5) 62.1 (53.2,70.2) 35.0 (27.8,43.0) Others 53.2 (32.0,73.3) 30.9 (15.1,52.9) 51.0 (29.6,72.0) 47.5 (25.6,70.5) 30.2 (14.2,53.2) Region East 70.9 (65.6,75.6) 31.3 (26.3,36.7) 58.5 (52.7,64.0) 59.3 (52.8,65.6) 27.7 (22.6,33.4) Central 64.8 (57.4,71.6) 25.6 (19.7,32.6) 49.0 (40.1,58.0) 50.0 (42.3,57.8) 23.3 (17.6,30.0) West 61.7 (53.6,69.2) 27.0 (21.6,33.2) 49.7 (42.3,57.2) 52.0 (43.5,60.3) 25.1 (19.8,31.2) 1 Educationlevelisreportedonlyamongrespondents25+yearsold. *Estimatebasedonlessthan25unweightedcases. 190
217 Table8.5:Percentageofadults15yearsoldwhoagree,disagree,orarenotsureiflowtarcigarettes arelessharmfulthangeneralcigarettes,bysmokingstatusandselecteddemographiccharacteristics GATSChina,2010. Demographic Characteristics CigarettesWhichareMarkedwithLowerTarareLessHarmful thangeneralcigarettes Total Agree Disagree Don tknow/notsure % N Percentage(95%CI) Overall 35.8 (32.1,39.8) 14.0 (11.4,16.9) 50.2 (45.9,54.4) ,329 Gender Male 44.7 (40.2,49.4) 14.7 (11.7,18.3) 40.6 (35.7,45.7) 100 6,593 Female 26.6 (23.4,30.1) 13.2 (10.9,15.9) 60.2 (56.3,64.0) 100 6,736 Age(years) (33.3,45.5) 16.1 (12.3,20.9) 44.6 (37.9,51.6) 100 1, (34.3,43.7) 15.9 (12.8,19.6) 45.2 (40.1,50.5) 100 4, (30.5,38.5) 11.9 (9.7,14.6) 53.7 (49.4,57.9) 100 4, (16.7,24.9) 7.5 (5.8,9.8) 72.0 (67.6,75.9) 100 2,203 Residence Urban 41.8 (36.8,47.0) 19.2 (14.5,25.0) 39.0 (34.0,44.2) 100 5,827 Rural 30.7 (26.3,35.6) 9.5 (7.2,12.4) 59.8 (54.3,65.0) 100 7,502 EducationLevel 1 PrimarySchoolorLess 21.3 (17.9,25.2) 5.6 (4.4,7.2) 73.1 (69.2,76.6) 100 4,948 AttendedSecondarySchool 38.7 (34.2,43.4) 11.4 (9.2,14.1) 49.8 (45.0,54.6) 100 4,107 HighSchoolGraduate 44.8 (39.0,50.8) 20.2 (15.8,25.5) 34.9 (29.5,40.8) 100 1,886 CollegeGraduateorAbove 45.9 (40.2,51.8) 30.3 (24.2,37.2) 23.8 (19.7,28.4) 100 1,238 Occupation 100 AgricultureWorker 27.1 (22.7,32.0) 6.0 (4.4,8.1) 66.9 (61.3,72.1) 100 5,361 MachineOperator 44.3 (38.1,50.6) 14.7 (12.0,17.9) 41.0 (34.8,47.5) 100 1,252 BusinessorServiceEmployee 43.7 (37.9,49.7) 14.8 (11.7,18.6) 41.4 (35.7,47.5) 100 1,689 LeadersofOrganizations 44.2 (36.1,52.5) 29.2 (21.2,38.7) 26.6 (19.3,35.5) Clerks 49.9 (39.9,59.8) 23.9 (16.1,34.0) 26.2 (17.0,38.2) SpecializedTechnicians 46.3 (37.5,55.2) 23.9 (18.0,31.0) 29.8 (23.9,36.5) Medical/HealthPersonnel 54.7 (44.4,64.6) 27.9 (19.5,38.2) 17.4 (11.3,25.8) TeachingStaff 48.3 (37.1,59.7) 22.9 (15.6,32.4) 28.8 (20.4,38.8) Soldiers 57.6 (21.4,87.1)* 21.4 (4.3,62.4)* 21.0 (3.9,63.5)* Students 39.7 (29.7,50.7) 21.4 (13.9,31.6) 38.8 (29.5,49.1) NoJobs 26.9 (22.1,32.2) 12.7 (8.9,17.9) 60.4 (53.0,67.4) 100 1,368 Retired 33.6 (27.1,40.9) 16.1 (11.8,21.6) 50.3 (42.3,58.3) 100 1,450 Others 25.9 (17.3,36.9) 16.5 (4.9,43.3) 57.6 (36.7,76.0) Region East 41.2 (36.7,45.8) 15.1 (11.6,19.5) 43.7 (38.0,49.5) 100 4,396 Central 28.9 (24.2,34.0) 14.8 (9.1,23.2) 56.3 (47.1,65.2) 100 3,937 West 35.4 (27.1,44.6) 11.9 (8.7,16.1) 52.7 (44.5,60.8) 100 4,996 1 Educationlevelisreportedonlyamongrespondents25+yearsold. *Estimatebasedonlessthan25unweightedcases. 191
218 Table8.5(cont.):Percentageofadults15yearsoldwhoagree,disagree,orarenotsureiflowtar cigarettesarelessharmfulthangeneralcigarettes,bysmokingstatusandselecteddemographic characteristics GATSChina,2010. Demographic Characteristics CigarettesWhichareMarkedwithLowerTarareLessHarmful thangeneralcigarettes Total Agree Disagree Don tknow/notsure % N Percentage(95%CI) CurrentSmoker (44.9,55.8) 10.7 (8.2,13.8) 38.9 (33.3,44.9) 100 4,004 Gender Male 51.3 (45.8,56.8) 11.0 (8.5,14.2) 37.7 (32.0,43.7) 100 3,766 Female 29.3 (19.6,41.4) 3.6 (1.7,7.3) 67.1 (55.3,77.1) Age(years) (44.6,67.9) 10.4 (6.2,16.9) 32.9 (22.0,46.1) (44.3,57.9) 12.9 (9.5,17.2) 36.0 (29.3,43.2) 100 1, (45.4,56.5) 9.7 (6.9,13.6) 39.3 (33.9,45.1) 100 1, (27.1,39.1) 3.8 (2.3,6.2) 63.4 (57.1,69.3) Residence Urban 60.1 (52.8,66.9) 13.0 (8.4,19.5) 27.0 (19.8,35.6) 100 1,520 Rural 43.1 (36.7,49.9) 9.0 (6.6,12.2) 47.8 (40.7,55.1) 100 2,484 EducationLevel 2 PrimarySchoolorLess 35.6 (30.6,40.9) 4.9 (3.4,7.1) 59.5 (54.0,64.9) 100 1,384 AttendedSecondarySchool 50.7 (44.0,57.3) 9.8 (7.5,12.6) 39.6 (33.1,46.4) 100 1,491 HighSchoolGraduate 58.9 (50.9,66.6) 15.8 (10.4,23.2) 25.3 (18.6,33.4) CollegeGraduateorAbove 60.1 (50.7,68.8) 19.9 (13.9,27.7) 20.0 (12.6,30.2) Occupation 100 AgricultureWorker 42.3 (35.8,49.0) 6.9 (4.7,10.1) 50.8 (43.4,58.1) 100 1,753 MachineOperator 52.5 (42.8,61.9) 11.4 (8.4,15.3) 36.2 (26.6,47.0) BusinessorServiceEmployee 63.2 (56.5,69.4) 11.1 (7.4,16.2) 25.8 (20.0,32.5) LeadersofOrganizations 55.5 (43.8,66.6) 21.6 (11.0,38.0) 22.9 (12.5,38.2) Clerks 53.9 (36.5,70.4) 20.3 (10.1,36.7) 25.8 (12.0,47.1) SpecializedTechnicians 58.0 (46.9,68.3) 17.3 (10.4,27.4) 24.7 (16.1,36.0) Medical/HealthPersonnel 69.1 (42.7,87.1) 12.1 (3.3,35.9) 18.8 (5.5,47.8) TeachingStaff 60.1 (41.3,76.3) 18.1 (8.4,34.8) 21.9 (7.6,48.9) Soldiers 97.4 (78.5,99.7)* 2.6 (0.3,21.5)* 0.0 (,)* Students 66.5 (27.5,91.2)* 0.2 (0.0,1.6)* 33.3 (8.7,72.4)* NoJobs 32.2 (22.1,44.4) 8.9 (4.8,16.0) 58.9 (45.1,71.3) Retired 50.6 (37.8,63.3) 8.9 (5.1,15.1) 40.5 (27.3,55.2) Others 51.4 (39.4,63.3) 12.8 (3.7,35.5) 35.9 (18.0,58.8) Region East 55.7 (49.0,62.3) 10.6 (7.1,15.5) 33.7 (25.7,42.8) 100 1,207 Central 45.2 (38.3,52.3) 12.1 (7.0,20.2) 42.7 (32.8,53.3) 100 1,217 West 48.9 (37.1,60.9) 9.8 (6.5,14.5) 41.3 (30.7,52.7) 100 1,580 1 Includesdailyandoccasional(lessthandaily)smokers 2 Educationlevelisreportedonlyamongrespondents25+yearsold. *Estimatebasedonlessthan25unweightedcases. 192
219 Table8.5(cont.):Percentageofadults15yearsoldwhoagree,disagree,orarenotsureiflowtar cigarettesarelessharmfulthangeneralcigarettes,bysmokingstatusandselecteddemographic characteristics GATSChina,2010. Demographic Characteristics CigarettesWhichareMarkedwithLowerTarareLessHarmful thangeneralcigarettes Total Agree Disagree Don tknow/notsure % N Percentage(95%CI) NonSmoker (26.6,34.0) 15.2 (12.6,18.3) 54.6 (50.5,58.7) 100 9,325 Gender Male 37.4 (32.2,42.9) 18.8 (14.6,23.8) 43.8 (38.3,49.5) 100 2,827 Female 26.5 (23.3,30.0) 13.4 (11.1,16.2) 60.0 (56.1,63.8) 100 6,498 Age(years) (29.4,42.0) 17.4 (13.0,22.8) 47.2 (40.4,54.1) (28.8,38.2) 17.2 (14.0,21.1) 49.4 (44.0,54.8) 100 3, (22.5,30.1) 13.0 (10.7,15.7) 60.9 (56.6,65.1) 100 3, (12.9,21.8) 8.7 (6.6,11.3) 74.5 (69.7,78.7) 100 1,613 Residence Urban 35.4 (30.4,40.6) 21.4 (16.6,27.2) 43.2 (38.5,48.1) 100 4,307 Rural 25.5 (21.2,30.3) 9.7 (7.3,12.7) 64.9 (59.4,70.0) 100 5,018 EducationLevel 2 PrimarySchoolorLess 16.7 (13.5,20.5) 5.9 (4.6,7.5) 77.5 (73.6,80.9) 100 3,564 AttendedSecondarySchool 32.0 (27.5,36.9) 12.4 (9.8,15.6) 55.6 (50.7,60.4) 100 2,616 HighSchoolGraduate 37.3 (31.5,43.4) 22.6 (18.3,27.6) 40.1 (33.8,46.7) 100 1,266 CollegeGraduateorAbove 40.8 (34.8,47.1) 34.0 (27.5,41.2) 25.2 (20.5,30.5) Occupation 100 AgricultureWorker 20.4 (16.1,25.5) 5.5 (3.9,7.9) 74.1 (68.4,79.0) 100 3,608 MachineOperator 35.8 (29.6,42.5) 18.2 (14.6,22.5) 46.0 (40.0,52.1) BusinessorServiceEmployee 35.5 (29.7,41.8) 16.4 (12.9,20.7) 48.1 (41.8,54.4) 100 1,175 LeadersofOrganizations 37.7 (29.2,47.0) 33.6 (25.9,42.1) 28.7 (20.0,39.4) Clerks 47.7 (35.3,60.3) 25.9 (16.8,37.8) 26.4 (15.1,42.0) SpecializedTechnicians 38.8 (29.5,48.9) 28.1 (20.7,37.0) 33.1 (26.3,40.6) Medical/HealthPersonnel 51.8 (39.4,64.0) 31.0 (22.2,41.5) 17.2 (10.5,26.7) TeachingStaff 46.3 (33.7,59.4) 23.8 (15.5,34.7) 29.9 (20.9,40.8) Soldiers 21.7 (2.7,73.9)* 38.4 (7.2,83.4)* 39.8 (7.9,83.6)* Students 39.4 (29.3,50.5) 21.7 (14.1,32.0) 38.9 (29.5,49.2) NoJobs 25.9 (21.4,31.1) 13.4 (9.3,18.9) 60.7 (53.3,67.6) 100 1,144 Retired 29.8 (23.5,36.9) 17.7 (13.0,23.7) 52.5 (44.9,60.0) 100 1,174 Others 9.9 (3.0,28.2) 18.9 (5.2,49.9) 71.2 (48.4,86.7) Region East 36.0 (31.1,41.3) 16.8 (13.0,21.4) 47.2 (41.4,53.1) 100 3,189 Central 22.4 (18.3,27.2) 15.9 (9.9,24.5) 61.7 (52.5,70.1) 100 2,720 West 29.5 (22.1,38.1) 12.8 (9.4,17.2) 57.7 (49.9,65.2) 100 3,416 1 Includesformerandneversmokers. 2 Educationlevelisreportedonlyamongrespondents25+yearsold. *Estimatebasedonlessthan25unweightedcases. 193
220 Table8.6:Percentageofcurrentsmokers15yearsoldwhonoticedhealthwarningsoncigarette packagesandconsideredquittingbecauseofthewarninglabelsduringthelast30days,byselected demographiccharacteristics GATSChina,2010. DemographicCharacteristics NoticedHealthWarningson CigarettePackage 2 Currentsmokers 1 who ThoughtAboutQuittingBecause ofwarninglabel 2 Percentage(95%CI) N Percentage(95%CI) N Overall 86.7 (82.1,90.2) 4, (27.0,36.4) 3,999 Gender Male 88.2 (83.5,91.7) 3, (27.3,37.0) 3,761 Female 51.6 (38.6,64.5) (14.5,30.5) 238 Age(years) (73.7,97.6) (23.1,48.9) (87.0,95.0) 1, (27.7,36.8) 1, (80.5,88.5) 1, (26.5,37.3) 1, (48.9,65.3) (15.9,29.6) 585 Residence Urban 94.1 (91.1,96.1) 1, (23.5,38.1) 1,521 Rural 81.1 (74.4,86.4) 2, (26.9,38.6) 2,478 EducationLevel 3 PrimarySchoolorLess 66.1 (60.6,71.2) 1, (20.9,28.6) 1,377 AttendedSecondarySchool 90.3 (84.0,94.3) 1, (31.5,43.0) 1,494 HighSchoolGraduate 96.0 (92.6,97.8) (21.7,34.9) 620 CollegeGraduateorAbove 98.4 (95.1,99.5) (22.0,36.6) 327 Occupation AgricultureWorker 77.6 (69.1,84.3) 1, (25.2,38.2) 1,747 MachineOperator 91.3 (83.6,95.6) (25.7,40.8) 619 BusinessorServiceEmployee 95.6 (92.5,97.4) (27.5,44.3) 515 LeadersofOrganizations 92.4 (78.3,97.6) (16.7,38.2) 241 Clerks 97.3 (87.6,99.5) (23.7,58.6) 83 SpecializedTechnicians 96.9 (93.5,98.5) (21.7,41.5) 179 Medical/HealthPersonnel 96.9 (84.3,99.4) (22.0,75.2) 27 TeachingStaff (,) (11.4,37.8) 40 Soldiers (,)* (6.3,89.9)* 4 Students (,)* (2.6,57.4)* 9 NoJobs 77.2 (68.0,84.4) (13.5,34.4) 223 Retired 83.4 (72.0,90.7) (22.2,40.6) 276 Others 91.0 (70.4,97.7) (4.9,35.6) 34 Region East 89.4 (82.6,93.7) 1, (21.6,35.3) 1,205 Central 88.9 (84.1,92.4) 1, (27.2,37.3) 1,215 West 82.3 (71.5,89.6) 1, (25.4,45.3) 1,579 1 Includesdailyandoccasional(lessthandaily)smokers. 2 Duringthelast30days. 3 Educationlevelisreportedonlyamongrespondents25+yearsold. *Estimatebasedonlessthan25unweightedcase. 194
221 Table8.7:Percentageofadults15yearsoldwhonoticedanticigarettesmokinginformationduringthelast30days invariousplacesamongwhonoticedanticigarettesmokinginformation,bysmokingstatusandselecteddemographic characteristics GATSChina,2010. Places Overall Gender Age(years) Male Female Percentage (95%CI) Overall InNewspapersorinMagazin s 36.4 (33.3,39.7) 38.6 (35.0,42.4) 33.8 (30.2,37.6) 36.9 (32.1,42.0) 36.3 (32.7,40.0) OnTelevisionortheRadi 77.6 (74.7,80.2) 76.3 (72.5,79.7) 79.1 (76.3,81.7) 73.0 (67.7,77.7) 79.0 (76.0,81.8) OnTelevision 75.9 (72.9,78.8) 74.5 (70.5,78.1) 77.7 (74.8,80.3) 71.7 (66.4,76.4) 77.2 (74.0,80.2) OntheRadio 10.1 (7.7,13.0) 10.9 (8.3,14.2) 9.1 (6.8,12.1) 7.2 (4.4,11.7) 10.9 (8.4,14.2) OnBillboards 34.4 (30.3,38.6) 35.3 (30.6,40.2) 33.3 (29.5,37.4) 33.5 (27.7,39.8) 34.6 (30.6,39.0) OnPoster 17.8 (14.2,22.2) 17.7 (13.9,22.2) 18.0 (14.2,22.5) 21.0 (16.6,26.2) 16.9 (13.0,21.6) OnPublicWalls 31.6 (26.8,36.8) 34.4 (28.9,40.4) 28.1 (23.6,33.1) 29.2 (23.7,35.4) 32.3 (27.2,37.8) InCinema 3.9 (2.9,5.2) 4.3 (2.9,6.2) 3.4 (2.7,4.4) 8.0 (5.1,12.4) 2.6 (2.0,3.5) OnInternet 13.5 (11.3,16.1) 15.0 (12.0,18.6) 11.7 (9.7,14.1) 25.3 (20.5,30.7) 9.9 (8.0,12.1) OnPublicTransportation 34.0 (29.4,38.8) 35.1 (30.1,40.3) 32.6 (27.8,37.9) 36.6 (30.2,43.4) 33.1 (28.6,38.0) SomewhereElse 4.5 (3.3,6.1) 5.1 (3.6,7.0) 3.8 (2.6,5.4) 5.3 (3.5,7.9) 4.2 (3.1,5.8) Currentsmokers InNewspapersorinMagazines 35.2 (30.5,40.3) 35.4 (30.6,40.6) 28.1 (14.4,47.6) 31.3 (20.9,44.0) 35.8 (30.9,41.1) OnTelevisionortheRadio 76.0 (70.3,80.9) 75.7 (69.9,80.7) 85.5 (75.2,92.0) 64.6 (48.9,77.7) 77.8 (72.8,82.1) OnTelevision 74.4 (68.7,79.4) 74.1 (68.3,79.3) 84.2 (74.4,90.7) 62.7 (46.9,76.1) 76.3 (71.3,80.7) OntheRadio 9.8 (6.8,13.9) 10.0 (6.9,14.2) 4.4 (1.8,10.2) 4.9 (2.3,10.1) 10.6 (7.3,15.1) OnBillboards 32.8 (27.7,38.3) 33.0 (27.9,38.4) 26.5 (14.1,44.2) 27.9 (17.3,41.5) 33.6 (28.3,39.3) OnPoster 15.3 (11.4,20.2) 15.5 (11.5,20.6) 6.6 (2.6,15.7) 20.1 (9.7,37.0) 14.5 (10.5,19.7) OnPublicWalls 32.7 (25.9,40.3) 33.2 (26.3,41.0) 16.4 (10.0,25.7) 31.4 (20.1,45.4) 32.9 (26.0,40.8) InCinema 2.9 (2.1,4.1) 2.9 (2.1,4.2) 2.1 (0.6,7.7) 5.2 (2.5,10.4) 2.6 (1.7,3.7) OnInternet 12.7 (9.3,17.0) 13.0 (9.5,17.4) 3.6 (1.4,9.2) 28.5 (16.2,45.0) 10.2 (7.4,14.0) OnPublicTransportation 33.4 (27.4,39.9) 33.5 (27.6,40.1) 27.4 (16.3,42.2) 29.5 (20.2,40.8) 34.0 (28.0,40.5) SomewhereElse 3.8 (2.6,5.6) 3.9 (2.6,5.7) 1.3 (0.4,4.4) 5.2 (2.2,12.1) 3.6 (2.4,5.2) Nonsmokers InNewspapersorinMagazines 36.9 (33.7,40.3) 42.3 (37.6,47.1) 33.9 (30.3,37.7) 38.1 (32.6,43.9) 36.5 (32.9,40.2) OnTelevisionortheRadio 78.3 (75.5,80.8) 77.0 (73.3,80.3) 79.0 (76.2,81.6) 74.7 (68.7,79.9) 79.6 (76.9,82.1) OnTelevision 76.6 (73.6,79.3) 74.8 (70.8,78.4) 77.6 (74.7,80.2) 73.5 (67.5,78.8) 77.7 (74.8,80.4) OntheRadio 10.2 (7.8,13.2) 11.9 (9.0,15.7) 9.2 (6.8,12.3) 7.7 (4.5,13.0) 11.1 (8.6,14.2) OnBillboards 35.0 (31.0,39.3) 37.9 (32.4,43.6) 33.4 (29.6,37.5) 34.6 (28.8,41.0) 35.2 (31.2,39.4) OnPoster 18.9 (15.2,23.3) 20.1 (15.9,25.2) 18.2 (14.3,22.9) 21.2 (16.7,26.6) 18.0 (14.0,22.8) OnPublicWalls 31.1 (26.4,36.1) 35.8 (30.5,41.5) 28.3 (23.8,33.4) 28.7 (23.1,35.1) 31.9 (27.2,37.1) InCinema 4.3 (3.1,5.9) 5.8 (3.5,9.3) 3.4 (2.7,4.4) 8.6 (5.2,13.9) 2.6 (1.9,3.6) OnInternet 13.8 (11.5,16.5) 17.4 (13.9,21.5) 11.9 (9.8,14.3) 24.6 (19.2,30.9) 9.7 (7.9,12.0) OnPublicTransportation 34.2 (29.8,38.9) 36.8 (32.1,41.7) 32.7 (27.9,38.0) 38.1 (31.5,45.1) 32.7 (28.5,37.2) SomewhereElse 4.8 (3.4,6.6) 6.4 (4.4,9.3) 3.8 (2.6,5.5) 5.3 (3.5,8.0) 4.6 (3.3,6.3) *Estimatebasedonlessthan25unweightedcase. 195
222 Table8.7(cont.):Percentageofadults15yearsoldwhonoticedanticigarettesmokinginformationduringthelast 30daysinvariousplacesamongwhonoticedanticigarettesmokinginformation,bysmokingstatusandselected demographiccharacteristics GATSChina,2010. Places Overall Residence Region Urban Rural East Central West Percentage(95%CI) Overall InNewspapersorin Magazines 36.4 (33.3,39.7) 43.9 (39.5,48.4) 27.9 (22.8,33.6) 41.9 (36.5,47.5) 30.9 (24.2,38.6) 34.7 (29.9,39.8) OnTelevisionortheRadio 77.6 (74.7,80.2) 73.0 (69.8,76.1) 82.8 (78.4,86.4) 75.1 (69.8,79.8) 79.7 (75.5,83.3) 78.7 (73.8,83.0) OnTelevision 75.9 (72.9,78.8) 71.4 (68.1,74.5) 81.1 (76.3,85.2) 73.3 (67.7,78.2) 78.1 (73.5,82.0) 77.3 (71.7,82.0) OntheRadio 10.1 (7.7,13.0) 10.1 (7.8,13.1) 10.0 (6.2,15.8) 11.3 (8.2,15.4) 7.8 (5.6,10.8) 10.5 (5.7,18.7) OnBillboards 34.4 (30.3,38.6) 43.8 (38.9,48.9) 23.6 (17.8,30.5) 38.3 (31.8,45.2) 30.3 (23.2,38.5) 33.2 (25.6,41.7) OnPoster 17.8 (14.2,22.2) 25.9 (20.5,32.1) 8.7 (6.3,11.8) 21.8 (15.3,30.0) 12.6 (7.3,20.9) 17.6 (12.0,25.1) OnPublicWalls 31.6 (26.8,36.8) 41.8 (35.9,48.0) 19.9 (14.1,27.3) 36.2 (28.3,44.9) 27.6 (18.5,39.0) 29.5 (22.0,38.3) InCinema 3.9 (2.9,5.2) 5.5 (4.1,7.5) 2.0 (0.9,4.5) 5.4 (3.4,8.5) 2.2 (1.3,3.7) 3.5 (2.4,5.1) OnInternet 13.5 (11.3,16.1) 17.0 (14.3,20.2) 9.5 (6.7,13.3) 18.6 (14.5,23.6) 9.2 (7.2,11.8) 11.2 (8.2,15.1) OnPublicTransportation 34.0 (29.4,38.8) 38.9 (32.2,46.0) 28.3 (23.3,34.0) 31.3 (26.0,37.2) 36.0 (25.3,48.2) 35.3 (28.0,43.3) SomewhereElse 4.5 (3.3,6.1) 6.0 (4.3,8.3) 2.7 (1.5,4.8) 4.5 (2.7,7.3) 5.7 (3.5,9.0) 3.5 (1.9,6.2) Currentsmokers InNewspapersorin Magazines 35.2 (30.5,40.3) 42.5 (35.5,49.8) 28.1 (21.5,35.6) 39.8 (31.9,48.4) 28.4 (21.1,37.1) 35.6 (27.0,45.3) OnTelevisionortheRadio 76.0 (70.3,80.9) 71.1 (62.8,78.2) 80.8 (74.3,85.9) 72.0 (58.9,82.2) 81.4 (76.1,85.7) 76.0 (69.3,81.6) OnTelevision 74.4 (68.7,79.4) 69.1 (60.8,76.3) 79.7 (73.1,85.0) 69.6 (56.7,80.1) 79.7 (74.0,84.4) 75.4 (68.5,81.2) OntheRadio 9.8 (6.8,13.9) 10.8 (7.4,15.6) 8.8 (4.6,16.2) 10.4 (6.6,16.2) 10.8 (7.3,15.8) 8.3 (3.1,20.4) OnBillboards 32.8 (27.7,38.3) 40.4 (33.0,48.3) 25.3 (19.0,32.8) 35.5 (28.4,43.3) 31.8 (22.9,42.2) 30.7 (21.3,42.1) OnPoster 15.3 (11.4,20.2) 23.0 (16.8,30.7) 7.7 (5.1,11.6) 16.5 (10.0,26.0) 10.7 (6.2,17.9) 17.5 (10.6,27.6) OnPublicWalls 32.7 (25.9,40.3) 41.0 (31.7,50.9) 24.6 (16.2,35.6) 33.9 (25.5,43.6) 31.4 (18.6,47.9) 32.5 (20.5,47.3) InCinema 2.9 (2.1,4.1) 4.9 (3.4,7.0) 1.0 (0.4,2.3) 3.2 (1.8,5.6) 2.5 (1.4,4.6) 3.0 (1.5,5.7) OnInternet 12.7 (9.3,17.0) 18.5 (13.1,25.4) 7.0 (4.3,11.2) 18.7 (11.8,28.5) 6.2 (3.5,10.9) 11.4 (7.5,17.1) OnPublicTransportation 33.4 (27.4,39.9) 36.4 (27.7,46.0) 30.4 (23.9,37.8) 28.8 (21.9,36.8) 36.5 (23.9,51.3) 35.7 (25.8,47.0) SomewhereElse 3.8 (2.6,5.6) 4.5 (2.7,7.4) 3.1 (1.8,5.3) 3.5 (2.0,6.1) 4.1 (1.8,9.1) 3.8 (1.9,7.3) Nonsmokers InNewspapersorin Magazines 36.9 (33.7,40.3) 44.5 (39.7,49.3) 27.8 (23.0,33.2) 42.7 (36.8,48.8) 31.9 (24.9,39.9) 34.3 (30.3,38.5) OnTelevisionortheRadio 78.3 (75.5,80.8) 73.8 (70.0,77.3) 83.7 (79.8,87.0) 76.4 (71.3,80.8) 79.0 (74.2,83.1) 80.0 (75.5,83.9) OnTelevision 76.6 (73.6,79.3) 72.3 (68.5,75.7) 81.8 (77.2,85.7) 74.7 (69.6,79.2) 77.4 (72.5,81.7) 78.1 (72.7,82.7) OntheRadio 10.2 (7.8,13.2) 9.9 (7.5,12.9) 10.5 (6.5,16.6) 11.7 (8.4,15.9) 6.5 (4.6,9.3) 11.5 (6.4,19.8) OnBillboards 35.0 (31.0,39.3) 45.1 (40.6,49.7) 22.8 (16.9,30.0) 39.4 (32.3,46.9) 29.7 (23.0,37.4) 34.3 (27.3,42.2) OnPoster 18.9 (15.2,23.3) 26.9 (21.6,33.0) 9.2 (6.5,12.7) 23.8 (17.3,31.9) 13.4 (7.6,22.4) 17.6 (12.5,24.3) OnPublicWalls 31.1 (26.4,36.1) 42.1 (36.5,47.9) 17.7 (12.8,24.0) 37.1 (28.2,46.9) 26.0 (18.3,35.5) 28.1 (22.1,35.1) InCinema 4.3 (3.1,5.9) 5.8 (4.1,8.1) 2.5 (1.0,5.6) 6.3 (3.9,10.0) 2.1 (1.2,3.7) 3.8 (2.7,5.3) OnInternet 13.8 (11.5,16.5) 16.5 (13.8,19.5) 10.6 (7.4,15.2) 18.6 (14.2,23.9) 10.5 (8.1,13.5) 11.0 (8.2,14.7) OnPublicTransportation 34.2 (29.8,38.9) 39.9 (33.3,46.8) 27.4 (22.4,33.0) 32.3 (26.6,38.7) 35.8 (25.7,47.2) 35.1 (28.2,42.7) SomewhereElse 4.8 (3.4,6.6) 6.6 (4.7,9.2) 2.6 (1.3,5.0) 4.9 (2.8,8.2) 6.3 (4.0,9.7) 3.3 (1.7,6.3) *Estimatebasedonlessthan25unweightedcase. 196
223 Places Table9.1:Percentageofadults15yearsoldwhonoticedcigarettemarketingduringthelast30daysin variousplaces,byselecteddemographiccharacteristics GATSChina,2010. Overall Gender Age(years) Male Female Percentage(95%CI) NoticedAdvertisements InStores 4.1 (3.1,5.3) 5.2 (3.7,7.1) 2.9 (2.1,4.1) 4.7 (3.1,7.1) 3.9 (3.0,5.0) OnTelevision 7.4 (5.7,9.7) 8.2 (6.1,10.8) 6.7 (5.0,8.9) 10.0 (7.3,13.5) 6.7 (5.1,8.9) OntheRadio 0.7 (0.4,1.2) 0.8 (0.4,1.5) 0.6 (0.3,1.1) 0.6 (0.2,1.5) 0.7 (0.4,1.4) OnBillboards 4.3 (3.2,5.6) 5.3 (4.0,7.1) 3.1 (2.1,4.5) 5.9 (3.7,9.3) 3.8 (2.9,4.9) OnPosters 2.3 (1.4,3.5) 2.7 (1.7,4.3) 1.8 (1.0,3.1) 3.4 (2.1,5.3) 2.0 (1.1,3.3) InNewspapersorMagazines 2.4 (1.5,3.8) 3.0 (1.7,5.3) 1.8 (1.1,2.8) 3.3 (2.0,5.5) 2.2 (1.3,3.4) InCinemas 0.1 (0.0,0.2) 0.1 (0.0,0.2) 0.1 (0.0,0.3) 0.3 (0.1,0.7) 0.0 (0.0,0.1) OntheInternet 1.4 (0.9,2.2) 2.1 (1.2,3.6) 0.8 (0.5,1.2) 3.4 (2.1,5.6) 0.9 (0.5,1.6) OnPublicTransportation 1.2 (0.8,1.7) 1.3 (0.8,1.9) 1.0 (0.7,1.6) 1.5 (0.8,2.6) 1.1 (0.7,1.6) OnPublicWalls 1.7 (1.2,2.5) 2.1 (1.4,3.3) 1.3 (0.9,1.9) 1.2 (0.6,2.7) 1.8 (1.3,2.6) SomewhereElse 0.3 (0.2,0.5) 0.4 (0.2,0.7) 0.2 (0.1,0.3) 0.4 (0.2,1.0) 0.2 (0.2,0.4) NoticedSportsSponsorship 3.5 (2.6,4.7) 4.8 (3.6,6.4) 2.2 (1.4,3.5) 4.1 (2.4,6.7) 3.4 (2.6,4.4) Music,FashionEvents 1.2 (0.9,1.6) 1.6 (1.2,2.3) 0.7 (0.4,1.1) 1.4 (0.7,2.7) 1.1 (0.9,1.5) NoticedCigarettePromotions FreeSamples 0.5 (0.3,0.8) 0.8 (0.5,1.3) 0.2 (0.1,0.4) 0.5 (0.3,1.2) 0.5 (0.3,0.8) SalePrices 0.8 (0.4,1.4) 0.9 (0.5,1.6) 0.7 (0.3,1.4) 1.2 (0.5,2.4) 0.7 (0.3,1.4) Coupons 0.0 (0.0,0.1) 0.0 (0.0,0.2) 0.0 (0.0,0.1) 0.0 (,) 0.0 (0.0,0.1) FreeGifts/Discountson OtherProducts 1.0 (0.6,1.5) 1.4 (0.8,2.3) 0.6 (0.3,1.0) 1.2 (0.7,2.1) 0.9 (0.6,1.5) Clothing/ItemwithBrand Name/Logo 1.3 (0.8,2.2) 1.8 (1.1,3.0) 0.9 (0.4,1.7) 2.6 (1.3,5.0) 1.0 (0.6,1.6) MailPromotingCigarettes 0.0 (0.0,0.1) 0.0 (0.0,0.1) 0.0 (0.0,0.0) 0.0 (0.0,0.1) 0.0 (0.0,0.1) SingleSales 2.3 (1.8,3.0) 3.0 (2.2,4.1) 1.6 (1.1,2.3) 5.9 (4.0,8.7) 1.3 (1.0,1.8) NoticedAnyAdvertisement, Sponsorship,orPromotion 19.6 (16.9,22.7) 24.1 (20.6,28.0) 15.0 (12.5,17.7) 27.5 (23.1,32.4) 17.5 (14.8,20.5) *Estimatebasedonlessthan25unweightedcase. 197
224 Places Table9.1(cont.):Percentageofadults15yearsoldwhonoticedcigarettemarketingduringthelast30 daysinvariousplaces,byselecteddemographiccharacteristics GATSChina,2010. Overall Residence Region Urban Rural East Central West Percentage(95%CI) NoticedAdvertisements InStores 4.1 (3.1,5.3) 4.9 (3.7,6.5) 3.4 (2.1,5.3) 3.8 (2.2,6.4) 4.1 (2.6,6.4) 4.4 (3.0,6.3) OnTelevision 7.4 (5.7,9.7) 9.7 (6.9,13.4) 5.5 (4.2,7.3) 6.4 (4.4,9.2) 7.3 (4.5,11.5) 8.8 (5.2,14.5) OntheRadio 0.7 (0.4,1.2) 0.7 (0.4,1.1) 0.7 (0.3,1.7) 0.6 (0.3,1.2) 0.6 (0.3,1.3) 0.8 (0.3,2.6) OnBillboards 4.3 (3.2,5.6) 6.2 (4.6,8.2) 2.6 (1.7,3.9) 3.8 (2.3,6.3) 4.2 (2.4,7.2) 4.8 (3.2,7.2) OnPosters 2.3 (1.4,3.5) 3.8 (2.4,6.1) 0.9 (0.6,1.4) 2.3 (1.0,5.1) 1.5 (0.8,3.0) 2.8 (1.4,5.7) InNewspapersor Magazines 2.4 (1.5,3.8) 4.3 (2.7,6.7) 0.8 (0.6,1.2) 2.9 (1.3,6.1) 2.0 (1.1,3.5) 2.2 (1.0,4.9) InCinemas 0.1 (0.0,0.2) 0.1 (0.0,0.4) 0.0 (0.0,0.2) 0.1 (0.0,0.4) 0.1 (0.0,0.5) 0.0 (0.0,0.1) OntheInternet 1.4 (0.9,2.2) 2.1 (1.4,3.3) 0.8 (0.4,1.6) 1.8 (1.0,3.1) 1.6 (0.8,3.4) 0.9 (0.4,1.9) OnPublicTransportation 1.2 (0.8,1.7) 1.4 (0.8,2.3) 1.0 (0.6,1.7) 1.3 (0.6,2.7) 1.3 (0.8,2.2) 0.9 (0.6,1.5) OnPublicWalls 1.7 (1.2,2.5) 2.7 (1.9,3.9) 0.9 (0.5,1.5) 1.8 (1.0,3.1) 1.8 (0.8,4.0) 1.5 (0.9,2.4) SomewhereElse 0.3 (0.2,0.5) 0.5 (0.2,0.9) 0.1 (0.1,0.3) 0.3 (0.2,0.7) 0.3 (0.1,1.1) 0.2 (0.1,0.4) NoticedSportsSponsorship 3.5 (2.6,4.7) 5.0 (3.4,7.5) 2.2 (1.7,2.9) 2.6 (1.9,3.4) 3.1 (1.9,5.0) 4.9 (2.8,8.5) Music,FashionEvents 1.2 (0.9,1.6) 1.5 (1.1,1.9) 0.9 (0.5,1.6) 1.2 (0.8,1.8) 1.1 (0.6,2.0) 1.2 (0.6,2.2) NoticedCigarettePromotions FreeSamples 0.5 (0.3,0.8) 0.8 (0.4,1.3) 0.3 (0.1,0.6) 0.3 (0.1,0.8) 0.3 (0.2,0.6) 0.8 (0.4,1.6) SalePrices 0.8 (0.4,1.4) 0.8 (0.4,1.4) 0.8 (0.3,2.0) 0.4 (0.2,0.8) 1.3 (0.7,2.4) 0.8 (0.2,2.9) Coupons 0.0 (0.0,0.1) 0.0 (0.0,0.1) 0.0 (0.0,0.2) 0.0 (,) 0.0 (0.0,0.2) 0.1 (0.0,0.3) FreeGifts/Discountson OtherProducts 1.0 (0.6,1.5) 1.1 (0.7,1.7) 0.9 (0.4,1.8) 1.1 (0.6,2.3) 0.7 (0.4,1.3) 1.0 (0.5,2.0) Clothing/ItemwithBrand Name/Logo 1.3 (0.8,2.2) 0.9 (0.6,1.5) 1.7 (0.8,3.4) 0.7 (0.4,1.1) 0.5 (0.2,1.1) 2.8 (1.4,5.4) MailPromotingCigarettes 0.0 (0.0,0.1) 0.0 (0.0,0.1) 0.0 (0.0,0.1) 0.1 (0.0,0.1) 0.0 (,) 0.0 (0.0,0.1) SingleSales 2.3 (1.8,3.0) 1.8 (1.2,2.6) 2.8 (2.1,3.8) 1.9 (1.1,3.4) 1.5 (0.8,2.6) 3.5 (2.5,4.8) NoticedAnyAdvertisement, Sponsorship,orPromotion 19.6 (16.9,22.7) 24.2 (20.5,28.4) 15.7 (12.9,19.0) 18.4 (14.0,23.7) 17.7 (12.8,24.0) 22.6 (18.2,27.6) *Estimatebasedonlessthan25unweightedcase. 198
225 Places Table9.1(cont.):Percentageofcurrentsmokers15yearsoldwhonoticedcigarettemarketingduring thelast30daysinvariousplaces,byselecteddemographiccharacteristics GATSChina,2010. Overall Gender Age(years) Male Female Percentage(95%C.I) NoticedAdvertisements InStores 7.0 (4.8,10.1) 7.1 (4.8,10.3) 4.1 (1.9,8.9) 10.5 (5.7,18.7) 6.4 (4.5,9.0) OnTelevision 8.1 (6.0,10.8) 8.2 (6.1,11.0) 4.5 (2.3,8.8) 9.6 (5.6,15.9) 7.8 (5.7,10.6) OntheRadio 1.0 (0.5,2.4) 1.1 (0.5,2.5) 0.0 (,) 1.4 (0.2,7.5) 1.0 (0.4,2.5) OnBillboards 5.9 (4.2,8.2) 6.1 (4.4,8.4) 1.3 (0.3,6.7) 9.8 (3.9,22.5) 5.3 (3.7,7.6) OnPosters 3.1 (2.0,4.8) 3.2 (2.0,4.9) 1.3 (0.2,8.3) 4.1 (2.0,8.3) 2.9 (1.7,4.8) InNewspapersorMagazines 2.6 (1.6,4.2) 2.7 (1.6,4.4) 0.2 (0.0,1.8) 1.8 (0.6,5.2) 2.7 (1.6,4.6) InCinemas 0.0 (0.0,0.2) 0.0 (0.0,0.2) 0.0 (,) 0.1 (0.0,0.5) 0.0 (0.0,0.3) OntheInternet 1.3 (0.7,2.4) 1.4 (0.7,2.5) 0.2 (0.0,1.8) 2.5 (0.8,7.0) 1.1 (0.5,2.3) OnPublicTransportation 0.9 (0.6,1.5) 1.0 (0.6,1.6) 0.1 (0.0,0.7) 0.3 (0.1,1.3) 1.0 (0.6,1.7) OnPublicWalls 2.1 (1.2,3.7) 2.2 (1.2,3.9) 0.0 (,) 0.4 (0.1,2.1) 2.4 (1.3,4.2) SomewhereElse 0.5 (0.3,0.9) 0.5 (0.3,1.0) 0.0 (,) 1.1 (0.3,3.9) 0.4 (0.2,0.8) NoticedSportsSponsorship 5.0 (3.7,6.6) 5.1 (3.8,6.9) 1.0 (0.3,4.2) 3.0 (1.2,7.3) 5.3 (3.9,7.1) Music,FashionEvents 1.5 (1.0,2.3) 1.6 (1.0,2.4) 0.0 (,) 0.5 (0.1,3.4) 1.7 (1.1,2.5) NoticedCigarettePromotions FreeSamples 1.0 (0.6,1.7) 1.0 (0.6,1.7) 0.6 (0.1,4.1) 1.9 (0.7,4.6) 0.9 (0.5,1.5) SalePrices 0.8 (0.4,1.5) 0.8 (0.4,1.5) 0.4 (0.0,2.5) 1.6 (0.4,5.4) 0.7 (0.4,1.2) Coupons 0.0 (,) 0.0 (,) 0.0 (,) 0.0 (,) 0.0 (,) FreeGifts/DiscountsonOther Products 2.1 (1.2,3.9) 2.2 (1.2,4.0) 0.0 (,) 3.0 (1.2,7.3) 2.0 (1.0,3.9) Clothing/ItemwithBrand Name/Logo 2.0 (1.2,3.3) 2.1 (1.3,3.4) 0.0 (,) 4.4 (2.1,9.1) 1.6 (0.9,2.8) MailPromotingCigarettes 0.0 (0.0,0.2) 0.1 (0.0,0.2) 0.0 (,) 0.0 (,) 0.1 (0.0,0.2) SingleSales 2.6 (1.8,3.9) 2.7 (1.8,4.1) 0.2 (0.0,1.6) 6.6 (2.5,16.1) 2.0 (1.4,2.8) NoticedAnyAdvertisement, Sponsorship,orPromotion 24.7 (21.2,28.7) 25.4 (21.7,29.5) 9.6 (5.7,15.7) 34.5 (24.0,46.8) 23.2 (19.5,27.3) *Estimatebasedonlessthan25unweightedcase. 199
226 Places Table9.1(cont.):Percentageofcurrentsmokers15yearsoldwhonoticedcigarettemarketingduring thelast30daysinvariousplaces,byselecteddemographiccharacteristics GATSChina,2010. Overall Residence Region Urban Rural East Central West Percentage(95%CI) NoticedAdvertisements InStores 7.0 (4.8,10.1) 8.1 (5.3,12.4) 6.1 (3.4,10.5) 6.8 (3.3,13.3) 7.8 (4.1,14.3) 6.5 (3.6,11.4) OnTelevision 8.1 (6.0,10.8) 9.8 (6.7,14.2) 6.7 (4.5,9.9) 7.9 (5.4,11.4) 7.3 (4.6,11.4) 8.8 (4.8,15.7) OntheRadio 1.0 (0.5,2.4) 0.7 (0.3,1.5) 1.3 (0.4,3.8) 0.9 (0.3,2.8) 0.7 (0.4,1.4) 1.4 (0.3,6.0) OnBillboards 5.9 (4.2,8.2) 7.9 (5.4,11.6) 4.4 (2.7,7.0) 5.3 (3.1,8.8) 5.6 (2.6,11.7) 6.7 (4.1,10.7) OnPosters 3.1 (2.0,4.8) 5.4 (3.3,8.7) 1.4 (0.7,2.6) 3.3 (1.6,6.9) 2.4 (1.2,4.7) 3.4 (1.5,7.2) InNewspapersor Magazines 2.6 (1.6,4.2) 4.8 (2.9,7.9) 0.9 (0.5,1.8) 4.0 (2.1,7.6) 1.2 (0.5,2.9) 2.3 (1.0,5.3) InCinemas 0.0 (0.0,0.2) 0.1 (0.0,0.5) 0.0 (,) 0.0 (0.0,0.2) 0.1 (0.0,0.9) 0.0 (,) OntheInternet 1.3 (0.7,2.4) 2.3 (1.2,4.3) 0.6 (0.2,1.7) 2.6 (1.3,5.1) 0.6 (0.2,2.0) 0.5 (0.2,1.3) OnPublicTransportation 0.9 (0.6,1.5) 1.5 (0.9,2.5) 0.5 (0.3,0.9) 1.1 (0.4,2.7) 1.1 (0.7,1.8) 0.7 (0.3,1.4) OnPublicWalls 2.1 (1.2,3.7) 4.0 (2.3,6.9) 0.7 (0.3,1.4) 2.4 (0.8,6.8) 2.7 (1.2,6.0) 1.4 (0.7,2.8) SomewhereElse 0.5 (0.3,0.9) 0.7 (0.3,1.7) 0.3 (0.1,0.9) 0.9 (0.4,2.1) 0.2 (0.1,0.8) 0.3 (0.1,1.0) NoticedSportsSponsorship 5.0 (3.7,6.6) 7.7 (5.4,10.9) 2.9 (1.9,4.5) 4.3 (2.8,6.6) 4.8 (2.8,8.0) 5.7 (3.4,9.5) Music,FashionEvents 1.5 (1.0,2.3) 2.5 (1.5,4.1) 0.7 (0.4,1.5) 2.3 (1.3,4.3) 1.1 (0.6,2.2) 1.0 (0.4,2.2) NoticedCigarettePromotions FreeSamples 1.0 (0.6,1.7) 1.9 (1.0,3.3) 0.4 (0.1,1.1) 0.7 (0.3,1.8) 0.5 (0.2,1.2) 1.7 (0.9,3.4) SalePrices 0.8 (0.4,1.5) 1.1 (0.5,2.3) 0.6 (0.2,1.6) 0.6 (0.2,1.9) 1.8 (0.8,3.7) 0.3 (0.1,0.8) Coupons 0.0 (,) 0.0 (,) 0.0 (,) 0.0 (,) 0.0 (,) 0.0 (,) FreeGifts/Discountson OtherProducts 2.1 (1.2,3.9) 2.2 (1.3,3.5) 2.1 (0.8,5.5) 2.7 (0.9,7.9) 1.4 (0.7,2.6) 2.2 (0.9,5.0) Clothing/ItemwithBrand Name/Logo 2.0 (1.2,3.3) 1.7 (0.9,3.2) 2.3 (1.1,4.4) 1.1 (0.5,2.3) 0.9 (0.4,2.1) 3.7 (1.9,7.2) MailPromotingCigarettes 0.0 (0.0,0.2) 0.1 (0.0,0.5) 0.0 (0.0,0.3) 0.1 (0.0,0.5) 0.0 (,) 0.0 (0.0,0.0) SingleSales 2.6 (1.8,3.9) 2.2 (1.4,3.5) 3.0 (1.7,5.2) 2.6 (1.0,6.5) 1.9 (1.0,3.7) 3.2 (2.1,4.7) NoticedAnyAdvertisement, Sponsorship,orPromotion 24.7 (21.2,28.7) 30.1 (25.2,35.4) 20.7 (16.3,25.9) 24.6 (18.4,32.0) 22.4 (15.4,31.4) 26.6 (21.7,32.1) *Estimatebasedonlessthan25unweightedcase 200
227 Places Table9.1(cont.):Percentageofcurrentnonsmokers15yearsoldwhonoticedcigarettemarketing duringthelast30daysinvariousplaces,byselecteddemographiccharacteristics GATSChina,2010. Overall Gender Age(years) Male Female Percentage(95%CI) NoticedAdvertisements InStores 3.0 (2.3,3.8) 3.0 (2.1,4.3) 2.9 (2.1,4.0) 3.4 (2.3,5.1) 2.8 (2.1,3.7) OnTelevision 7.2 (5.4,9.5) 8.2 (5.7,11.5) 6.7 (5.0,9.0) 10.1 (7.2,14.0) 6.3 (4.7,8.3) OntheRadio 0.6 (0.3,1.0) 0.4 (0.1,1.1) 0.6 (0.4,1.1) 0.4 (0.2,1.2) 0.6 (0.3,1.1) OnBillboards 3.6 (2.6,5.0) 4.5 (3.0,6.6) 3.2 (2.2,4.6) 5.0 (2.9,8.7) 3.1 (2.3,4.2) OnPosters 1.9 (1.2,3.2) 2.3 (1.3,4.1) 1.8 (1.0,3.2) 3.2 (1.8,5.7) 1.5 (0.8,2.8) InNewspapersorMagazines 2.3 (1.4,3.8) 3.4 (1.6,6.8) 1.8 (1.2,2.8) 3.7 (2.1,6.3) 1.9 (1.2,3.0) InCinemas 0.1 (0.0,0.2) 0.1 (0.0,0.5) 0.1 (0.0,0.3) 0.3 (0.1,0.9) 0.0 (0.0,0.1) OntheInternet 1.5 (1.0,2.3) 2.9 (1.6,5.3) 0.8 (0.5,1.2) 3.6 (2.1,6.2) 0.8 (0.4,1.4) OnPublicTransportation 1.3 (0.8,1.9) 1.6 (0.9,2.8) 1.1 (0.7,1.7) 1.7 (0.9,3.1) 1.1 (0.7,1.6) OnPublicWalls 1.5 (1.1,2.2) 2.0 (1.2,3.4) 1.3 (0.9,1.9) 1.4 (0.6,3.2) 1.6 (1.2,2.2) SomewhereElse 0.2 (0.1,0.4) 0.3 (0.0,1.4) 0.2 (0.1,0.3) 0.3 (0.1,1.2) 0.2 (0.1,0.3) NoticedSportsSponsorship 3.0 (2.0,4.3) 4.4 (2.9,6.4) 2.3 (1.4,3.5) 4.3 (2.4,7.5) 2.5 (1.9,3.4) Music,FashionEvents 1.0 (0.7,1.5) 1.7 (1.0,2.9) 0.7 (0.4,1.1) 1.5 (0.8,3.1) 0.9 (0.6,1.3) NoticedCigarettePromotions FreeSamples 0.3 (0.2,0.5) 0.5 (0.2,1.0) 0.2 (0.1,0.4) 0.3 (0.1,0.7) 0.3 (0.2,0.5) SalePrices 0.8 (0.4,1.6) 1.0 (0.4,2.3) 0.7 (0.3,1.5) 1.1 (0.4,2.6) 0.7 (0.2,1.9) Coupons 0.1 (0.0,0.1) 0.1 (0.0,0.4) 0.0 (0.0,0.1) 0.0 (,) 0.1 (0.0,0.2) FreeGifts/Discountson OtherProducts 0.5 (0.3,0.8) 0.4 (0.2,0.8) 0.6 (0.3,1.0) 0.8 (0.4,1.8) 0.4 (0.3,0.7) Clothing/ItemwithBrand Name/Logo 1.1 (0.6,2.0) 1.5 (0.6,3.4) 0.9 (0.5,1.7) 2.2 (0.8,5.5) 0.7 (0.4,1.3) MailPromotingCigarettes 0.0 (0.0,0.0) 0.0 (0.0,0.1) 0.0 (0.0,0.0) 0.0 (0.0,0.1) 0.0 (0.0,0.0) SingleSales 2.2 (1.6,3.0) 3.3 (2.1,5.0) 1.7 (1.2,2.4) 5.8 (3.8,8.7) 1.0 (0.7,1.5) NoticedAnyAdvertisement, Sponsorship,orPromotion 17.6 (15.0,20.6) 22.7 (18.7,27.3) 15.1 (12.6,17.9) 26.0 (21.9,30.6) 14.9 (12.4,17.8) *Estimatebasedonlessthan25unweightedcase. 201
228 Places Table9.1(cont.):Percentageofcurrentnonsmokers15yearsoldwhonoticedcigarettemarketing duringthelast30daysinvariousplaces,byselecteddemographiccharacteristics GATSChina,2010. Overall Residence Region Urban Rural East Central West Percentage(95%CI) NoticedAdvertisements InStores 3.0 (2.3,3.8) 3.8 (2.9,4.9) 2.2 (1.3,3.8) 2.8 (1.8,4.3) 2.6 (1.8,3.7) 3.5 (2.2,5.4) OnTelevision 7.2 (5.4,9.5) 9.6 (6.8,13.4) 5.0 (3.9,6.4) 5.9 (3.9,8.7) 7.3 (4.4,11.8) 8.8 (5.2,14.6) OntheRadio 0.6 (0.3,1.0) 0.6 (0.3,1.3) 0.5 (0.2,1.1) 0.5 (0.2,1.4) 0.6 (0.3,1.4) 0.6 (0.2,1.6) OnBillboards 3.6 (2.6,5.0) 5.6 (3.9,8.0) 1.8 (1.2,2.8) 3.3 (1.8,6.0) 3.6 (2.2,5.8) 3.9 (2.1,7.3) OnPosters 1.9 (1.2,3.2) 3.3 (2.0,5.4) 0.7 (0.4,1.3) 1.9 (0.8,4.8) 1.2 (0.6,2.5) 2.6 (1.2,5.3) InNewspapersor Magazines 2.3 (1.4,3.8) 4.1 (2.5,6.4) 0.8 (0.5,1.4) 2.5 (1.0,5.9) 2.3 (1.3,4.1) 2.2 (1.0,4.8) InCinemas 0.1 (0.0,0.2) 0.1 (0.0,0.5) 0.1 (0.0,0.3) 0.1 (0.0,0.6) 0.2 (0.0,0.6) 0.0 (0.0,0.2) OntheInternet 1.5 (1.0,2.3) 2.1 (1.3,3.3) 0.9 (0.5,2.0) 1.5 (0.8,2.7) 2.0 (1.0,4.2) 1.0 (0.5,2.3) OnPublicTransportation 1.3 (0.8,1.9) 1.3 (0.8,2.2) 1.2 (0.7,2.1) 1.3 (0.6,2.9) 1.4 (0.8,2.4) 1.0 (0.6,1.8) OnPublicWalls 1.5 (1.1,2.2) 2.2 (1.5,3.2) 0.9 (0.5,1.6) 1.6 (0.9,2.6) 1.5 (0.7,3.3) 1.6 (1.0,2.5) SomewhereElse 0.2 (0.1,0.4) 0.4 (0.2,0.9) 0.1 (0.0,0.1) 0.1 (0.1,0.4) 0.3 (0.1,1.6) 0.2 (0.1,0.4) NoticedSportsSponsorship 3.0 (2.0,4.3) 4.1 (2.5,6.6) 1.9 (1.4,2.6) 1.9 (1.3,2.9) 2.5 (1.5,4.1) 4.6 (2.4,8.7) Music,FashionEvents 1.0 (0.7,1.5) 1.1 (0.7,1.6) 1.0 (0.5,1.9) 0.8 (0.5,1.4) 1.1 (0.6,2.1) 1.3 (0.6,2.6) NoticedCigarette Promotions FreeSamples 0.3 (0.2,0.5) 0.4 (0.2,0.7) 0.2 (0.1,0.6) 0.2 (0.1,0.6) 0.3 (0.1,0.7) 0.4 (0.2,0.8) SalePrices 0.8 (0.4,1.6) 0.7 (0.3,1.4) 0.9 (0.3,2.6) 0.3 (0.1,0.7) 1.2 (0.6,2.2) 1.1 (0.3,4.3) Coupons 0.1 (0.0,0.1) 0.0 (0.0,0.1) 0.1 (0.0,0.2) 0.0 (,) 0.1 (0.0,0.3) 0.1 (0.0,0.4) FreeGifts/Discountson OtherProducts 0.5 (0.3,0.8) 0.7 (0.4,1.2) 0.3 (0.1,0.9) 0.6 (0.3,1.1) 0.4 (0.2,1.1) 0.5 (0.2,1.3) Clothing/ItemwithBrand Name/Logo 1.1 (0.6,2.0) 0.7 (0.4,1.3) 1.4 (0.6,3.3) 0.5 (0.2,1.0) 0.3 (0.1,1.0) 2.4 (1.1,5.1) MailPromotingCigarettes 0.0 (0.0,0.0) 0.0 (0.0,0.1) 0.0 (0.0,0.0) 0.0 (0.0,0.1) 0.0 (,) 0.0 (0.0,0.1) SingleSales 2.2 (1.6,3.0) 1.6 (1.0,2.6) 2.7 (1.9,3.9) 1.7 (0.8,3.3) 1.3 (0.6,2.6) 3.6 (2.5,5.3) NoticedAnyAdvertisement, Sponsorship,orPromotion 17.6 (15.0,20.6) 22.2 (18.5,26.3) 13.5 (11.1,16.4) 16.2 (12.0,21.4) 15.9 (11.5,21.5) 20.8 (16.4,26.1) *Estimatebasedonlessthan25unweightedcase. 202
229 Table9.2:Percentageofadults15yearsoldwhonoticedcigarettemarketingduringthelast30daysin variousplacesamongwhonoticedcigarettemarketing,byselecteddemographiccharacteristics GATS China,2010. Places Overall *Estimatebasedonlessthan25unweightedcase. Gender Percentage(95%CI) Age(years) Male Female NoticedAdvertisements InStores 20.8 (16.5,26.0) 21.5 (16.2,27.9) 19.7 (14.8,25.8) 17.1 (12.0,23.7) 22.5 (17.8,27.9) OnTelevision 38.0 (31.9,44.6) 34.0 (27.8,40.8) 44.7 (37.3,52.3) 36.4 (28.7,44.9) 38.7 (32.4,45.5) OntheRadio 3.5 (2.1,6.0) 3.2 (1.7,6.0) 4.2 (2.4,7.1) 2.2 (0.9,5.4) 4.1 (2.3,7.5) OnBillboards 21.7 (18.3,25.5) 22.2 (18.5,26.4) 20.9 (15.9,27.0) 21.4 (14.2,30.9) 21.9 (18.9,25.2) OnPosters 11.5 (8.1,16.2) 11.4 (8.0,16.0) 11.7 (7.2,18.6) 12.3 (8.3,17.9) 11.2 (7.3,16.8) InNewspapersorMagazines 12.3 (8.5,17.4) 12.5 (7.6,19.9) 11.9 (8.6,16.3) 12.1 (7.5,18.9) 12.4 (8.6,17.4) InCinemas 0.4 (0.2,1.0) 0.3 (0.1,1.0) 0.6 (0.2,2.1) 1.0 (0.4,2.6) 0.1 (0.0,0.5) OntheInternet 7.3 (5.2,10.2) 8.6 (5.4,13.4) 5.1 (3.1,8.1) 12.4 (7.9,18.9) 5.1 (3.1,8.4) OnPublicTransportation 5.9 (4.3,8.2) 5.3 (3.8,7.4) 7.0 (4.6,10.5) 5.4 (3.0,9.3) 6.2 (4.6,8.3) OnPublicWalls 8.7 (6.7,11.3) 8.8 (6.2,12.3) 8.5 (6.0,12.0) 4.4 (2.2,8.8) 10.6 (8.2,13.5) SomewhereElse 1.5 (0.9,2.4) 1.6 (0.9,3.1) 1.2 (0.6,2.1) 1.6 (0.7,3.6) 1.4 (0.8,2.3) NoticedSportsSponsorship 18.0 (13.9,23.0) 19.8 (15.3,25.2) 14.9 (10.0,21.7) 14.7 (9.1,23.0) 19.4 (15.6,23.8) Music,FashionEvents 6.0 (4.5,7.9) 6.8 (5.0,9.3) 4.6 (3.0,6.9) 4.9 (2.5,9.3) 6.4 (4.9,8.5) NoticedCigarettePromotions FreeSamples 2.5 (1.6,3.8) 3.2 (2.0,5.2) 1.4 (0.7,2.5) 2.0 (0.9,4.2) 2.7 (1.7,4.3) SalePrices 4.0 (2.3,7.0) 3.7 (2.1,6.4) 4.5 (2.1,9.3) 4.2 (2.1,8.3) 3.9 (1.9,8.0) Coupons 0.2 (0.1,0.5) 0.1 (0.0,0.7) 0.3 (0.1,0.9) 0.0 (,) 0.3 (0.1,0.7) FreeGifts/DiscountsonOther Products 5.0 (3.3,7.6) 5.7 (3.4,9.4) 3.8 (2.1,6.7) 4.3 (2.3,8.0) 5.3 (3.2,8.5) Clothing/ItemwithBrand Name/Logo 6.8 (4.0,11.4) 7.5 (4.4,12.3) 5.8 (2.9,11.3) 9.3 (4.6,17.8) 5.8 (3.5,9.4) MailPromotingCigarettes 0.1 (0.1,0.3) 0.2 (0.1,0.5) 0.1 (0.0,0.3) 0.1 (0.0,0.4) 0.2 (0.1,0.4) Single 11.8 (8.6,16.0) 12.4 (8.7,17.5) 10.9 (7.4,15.8) 21.6 (14.4,31.1) 7.6 (5.4,10.7) 203
230 Places Table9.2(cont):Percentageofadults15yearsoldwhonoticedcigarettemarketingduringthelast30 daysinvariousplacesamongwhonoticedcigarettemarketing,byselecteddemographiccharacteristics GATSChina,2010. Overall Residence NoticedAdvertisements Region Urban Rural East Central West Percentage(95%CI) InStores 20.8 (16.5,26.0) 20.4 (15.3,26.6) 21.5 (15.4,29.1) 20.8 (12.8,31.8) 23.1 (18.4,28.6) 19.4 (13.2,27.8) OnTelevision 38.0 (31.9,44.6) 40.0 (32.1,48.4) 35.4 (28.3,43.2) 34.9 (28.7,41.6) 41.2 (32.7,50.2) 38.9 (26.0,53.6) OntheRadio 3.5 (2.1,6.0) 2.7 (1.7,4.4) 4.6 (2.0,10.2) 3.3 (1.9,5.7) 3.6 (2.1,6.1) 3.8 (1.2,11.4) OnBillboards 21.7 (18.3,25.5) 25.6 (21.7,29.9) 16.6 (12.3,22.0) 20.9 (15.8,27.2) 23.7 (17.4,31.4) 21.2 (15.8,27.8) OnPosters 11.5 (8.1,16.2) 15.9 (11.0,22.3) 5.8 (4.2,8.0) 12.5 (6.6,22.3) 8.6 (5.5,13.2) 12.5 (7.1,21.1) InNewspapersorMagazines 12.3 (8.5,17.4) 17.6 (12.5,24.3) 5.3 (3.8,7.2) 15.6 (8.5,26.9) 11.2 (8.2,15.1) 9.9 (5.2,18.1) InCinemas 0.4 (0.2,1.0) 0.5 (0.2,1.5) 0.3 (0.1,1.4) 0.4 (0.1,2.3) 0.8 (0.3,2.7) 0.1 (0.0,0.5) OntheInternet 7.3 (5.2,10.2) 8.8 (6.0,12.8) 5.3 (2.7,10.2) 9.6 (6.4,14.1) 9.3 (5.2,16.2) 3.9 (2.0,7.6) OnPublicTransportation 5.9 (4.3,8.2) 5.6 (3.5,9.0) 6.4 (4.2,9.5) 6.9 (4.0,11.7) 7.6 (4.7,11.9) 4.0 (2.3,6.8) OnPublicWalls 8.7 (6.7,11.3) 11.1 (8.4,14.4) 5.6 (3.6,8.5) 9.7 (6.7,13.8) 10.3 (5.9,17.6) 6.7 (4.7,9.6) SomewhereElse 1.5 (0.9,2.4) 2.0 (1.0,3.9) 0.8 (0.3,1.8) 1.8 (0.9,3.9) 1.8 (0.5,5.9) 0.9 (0.5,1.8) NoticedSportsSponsorship 18.0 (13.9,23.0) 20.8 (14.7,28.6) 14.2 (11.2,17.9) 14.0 (9.3,20.4) 17.7 (13.4,23.0) 21.9 (14.4,31.9) Music,FashionEvents 6.0 (4.5,7.9) 6.0 (4.5,8.0) 5.9 (3.3,10.3) 6.7 (4.6,9.6) 6.2 (3.5,10.7) 5.2 (3.0,8.9) NoticedCigarettePromotions FreeSamples 2.5 (1.6,3.8) 3.2 (1.8,5.5) 1.6 (0.7,3.6) 1.8 (0.8,4.1) 1.8 (1.0,3.1) 3.6 (2.0,6.6) SalePrices 4.0 (2.3,7.0) 3.2 (1.8,5.7) 5.0 (2.1,11.6) 2.0 (0.9,4.4) 7.5 (5.0,11.3) 3.6 (0.9,12.8) Coupons 0.2 (0.1,0.5) 0.1 (0.0,0.5) 0.3 (0.1,1.0) 0.0 (,) 0.2 (0.0,1.2) 0.3 (0.1,1.2) FreeGifts/Discountson OtherProducts 5.0 (3.3,7.6) 4.6 (2.8,7.2) 5.6 (2.8,10.8) 6.2 (3.1,12.0) 3.8 (2.1,6.9) 4.6 (2.2,9.2) Clothing/ItemwithBrand Name/Logo 6.8 (4.0,11.4) 3.9 (2.3,6.6) 10.7 (5.4,20.0) 3.6 (1.9,6.6) 2.9 (1.3,6.2) 12.4 (6.2,23.5) MailPromotingCigarettes 0.1 (0.1,0.3) 0.1 (0.0,0.4) 0.1 (0.0,0.4) 0.3 (0.1,0.8) 0.0 (,) 0.1 (0.0,0.5) Single 11.8 (8.6,16.0) 7.2 (4.6,11.2) 17.9 (13.0,24.1) 10.4 (5.1,20.1) 8.2 (4.6,14.3) 15.5 (10.4,22.3) *Estimatebasedonlessthan25unweightedcase. 204
231 Table10.1ImplementationstatusofWHOFCTCinChina(selectedmeasures)GATSChina2010 Tobaccocontrol measures Protectpeoplefrom SHS Offerhelpfor cessation Warnaboutthe dangersoftobacco Enforcebanson tobaccoadvertising, promotion& sponsorship Increasetobacco taxes&prices Indicatorsusedinthissurvey Percentageofrespondentswhonoticedsmokingattheirindoorwork placesintheprevious30days Percentageofrespondentswhonoticedsmokinginindoorpublicplaces inprevious30days. Percentageofsmokersreportingthattheywereadvisedtoquitwhen seenbyadoctororotherhealthprofessionalduringtheprevious12 months. Percentageofsmokerswhoattemptedtoquitwithoutanycessationaids duringtheprevious12months. Percentageofrespondentswhonoticedinformationonthedangersof smokingduringtheprevious30days Percentageofrespondentswhothoughtaboutquittingafterseeingthe healthwarningsonthecigarettepackages Percentageofrespondentswhonoticedtobaccopromotionduringthe previous30days. PercentageofrespondentswhonoticedtobaccopromotiononTVamong thosewhonoticedtobaccomarketingduringtheprevious30days. Maximumexpendituretobuyapackofcigarettespaidby50%of smokers Expenditureof100packsofcigarettesasapercentageof2009GDPper capita. Measurable Results 63.3% 72.7% 33.9% 91.8% 59.8% 36.4% 19.6% 49.8% RMB % 205
232
233

234 未标题 :21:47
~ ~
 * 40 4 2016 7 Vol. 40 No. 4 July 2016 35 Population Research 2014 1 2016 2016 9101. 0 40 49. 6% 2017 ~ 2021 1719. 5 160 ~ 470 100872 Accumulated Couples and Extra Births under the Universal Tw o-child
??? 1
 浙 江 省 肿 瘤 预 防 与 控 制 工 作 介 绍 Introduction to cancer control and prevention in Zhejiang Province 浙 江 省 疾 病 预 防 控 制 中 心 Zhejiang Provincial Center for Disease Control and Prevention 1 提 纲 (Outline) 流 行 病
國立中山大學學位論文典藏.PDF
 The Study on the New Pension Scheme for Civil Servants Evidence from Kaohsiung County I II 1. III Thesis Abstract Title of Thesis The Study on the New Pension Scheme for Civil Servants: Evidence from Kaohsiung
untitled
 01 1-1 1-2 1-3 1-4 1-5 1. 2. 3. 1-1 (epidemiology) epidemiology epi(among) demos (people) logos(doctrine) 2 01 1. (epidemic) 2. (endemic) 3. (pandemic) (Severe Acute Respiratory Syndrome, SARS) 1-2 1.
Chinese oil import policies and reforms 随 着 经 济 的 发 展, 目 前 中 国 石 油 消 费 总 量 已 经 跃 居 世 界 第 二 作 为 一 个 负 责 任 的 大 国, 中 国 正 在 积 极 推 进 能 源 进 口 多 元 化, 鼓 励 替 代
 Chinese oil import policies and reforms SINOPEC EDRI 2014.8 Chinese oil import policies and reforms 随 着 经 济 的 发 展, 目 前 中 国 石 油 消 费 总 量 已 经 跃 居 世 界 第 二 作 为 一 个 负 责 任 的 大 国, 中 国 正 在 积 极 推 进 能 源 进 口 多 元 化,
國家圖書館典藏電子全文
 i ii Abstract The most important task in human resource management is to encourage and help employees to develop their potential so that they can fully contribute to the organization s goals. The main
by mild (22.7%). Inhaled corticosteroids, systemic corticosteroids, and antibiotics were applied to 94.8% (292 cases), 74.7% (230 cases), and 90.9% (2
. Inhaled corticosteroids, systemic corticosteroids, and antibiotics were applied to 94.8% (292 cases), 74.7% (230 cases), and 90.9% (2") 论 著 临 床 研 究 doi: 0.7499/j.issn.008-8830.204.2.007 郑 州 市 城 区 儿 童 哮 喘 的 流 行 病 学 调 查 及 发 病 相 关 因 素 分 析 赵 坤 宋 桂 华 古 华 倩 2 刘 爽 3 张 岩 郭 彦 荣 (. 河 南 中 医 学 院 第 一 附 属 医 院 儿 科 医 院, 河 南 郑 州 450000; 2. 杭 州 市 余 杭 区
论 著 临 床 研 究 doi: 0.7499/j.issn.008-8830.204.2.007 郑 州 市 城 区 儿 童 哮 喘 的 流 行 病 学 调 查 及 发 病 相 关 因 素 分 析 赵 坤 宋 桂 华 古 华 倩 2 刘 爽 3 张 岩 郭 彦 荣 (. 河 南 中 医 学 院 第 一 附 属 医 院 儿 科 医 院, 河 南 郑 州 450000; 2. 杭 州 市 余 杭 区
%
 38 1 2014 1 Vol. 38No. 1 January 2014 51 Population Research 2010 2010 2010 65 100028 Changing Lineal Families with Three Generations An Analysis of the 2010 Census Data Wang Yuesheng Abstract In contemporary
菸 害 防 治 預 防 改 善 措 施 (1) 第 一 階 段 - 裝 設 自 動 語 音 警 告 感 應 設 施 地 點 A 棟 二 側 樓 梯 未 裝 機 (11/1~11/30) 裝 機 時 (12/1~12/31) 6A 7A 8A 9A 10A 總 數 82 652 125 1153 39
 第 一 階 段 - 裝 設 自 動 語 音 警 告 感 應 設 施 地 點 A 棟 二 側 樓 梯 未 裝 機 (11/1~11/30) 裝 機 時 (12/1~12/31) 6A 7A 8A 9A 10A 總 數 82 652 125 1153 39") 機 構 名 稱 : 戴 德 森 醫 療 財 團 法 人 嘉 義 基 督 教 醫 院 4.1.1 Working conditions comply with national/regional directives and indicators [Evidence: e.g. national and international (EU) regulations are recognized]. 工
機 構 名 稱 : 戴 德 森 醫 療 財 團 法 人 嘉 義 基 督 教 醫 院 4.1.1 Working conditions comply with national/regional directives and indicators [Evidence: e.g. national and international (EU) regulations are recognized]. 工
Microsoft Word - Alan Jameson's Master's Thesis.pdf
 Obstacles and Opportunities for Microcredit Companies Developing in the Countryside Dissertation Presented in Partial Fulfillment of the Requirements for Master of Arts in the Graduate School of The Ohio
國立中山大學學位論文典藏.PDF
 I II III The Study of Factors to the Failure or Success of Applying to Holding International Sport Games Abstract For years, holding international sport games has been Taiwan s goal and we are on the way
度 身 體 活 動 量 ; 芬 蘭 幼 兒 呈 現 中 度 身 體 活 動 量 之 比 例 高 於 臺 灣 幼 兒 (5) 幼 兒 在 投 入 度 方 面 亦 達 顯 著 差 異 (χ²=185.35, p <.001), 芬 蘭 與 臺 灣 幼 兒 多 半 表 現 出 中 度 投 入 與 高 度
 幼 兒 在 投 入 度 方 面 亦 達 顯 著 差 異 (χ²=185.35, p <.001), 芬 蘭 與 臺 灣 幼 兒 多 半 表 現 出 中 度 投 入 與 高 度") 臺 灣 與 芬 蘭 幼 兒 園 室 內 自 由 遊 戲 內 涵 之 探 討 林 昭 溶 毛 萬 儀 經 國 管 理 暨 健 康 學 院 幼 兒 保 育 系 副 教 授 joyce@ems.cku.edu.tw 吳 敏 而 國 家 教 育 研 究 院 研 究 員 rozwu@mail.naer.edu.tw wanyi@ems.cku.edu.tw 摘 要 自 由 遊 戲 被 視 為 是 幼 兒 的
臺 灣 與 芬 蘭 幼 兒 園 室 內 自 由 遊 戲 內 涵 之 探 討 林 昭 溶 毛 萬 儀 經 國 管 理 暨 健 康 學 院 幼 兒 保 育 系 副 教 授 joyce@ems.cku.edu.tw 吳 敏 而 國 家 教 育 研 究 院 研 究 員 rozwu@mail.naer.edu.tw wanyi@ems.cku.edu.tw 摘 要 自 由 遊 戲 被 視 為 是 幼 兒 的
 硕 士 专 业 学 位 论 文 论 文 题 目 无 锡 市 区 机 关 公 务 员 健 身 锻 炼 现 状 研 究 The Study on Physical Exercises of Civil Servants in Wuxi 研 究 生 姓 名 张 征 指 导 教 师 姓 名 陆 阿 明 教 授 专 业 名 称 研 究 方 向 论 文 提 交 日 期 体 育 教 育 训 练 学 体 育 健 身
厦 门 大 学 学 位 论 文 原 创 性 声 明 本 人 呈 交 的 学 位 论 文 是 本 人 在 导 师 指 导 下, 独 立 完 成 的 研 究 成 果 本 人 在 论 文 写 作 中 参 考 其 他 个 人 或 集 体 已 经 发 表 的 研 究 成 果, 均 在 文 中 以 适 当 方
 学 校 编 码 :10384 分 类 号 密 级 学 号 : UDC 硕 士 学 位 论 文 浙 江 省 人 事 考 试 突 发 事 件 应 对 策 略 探 析 An Exploration of Zhejiang Province Personnel Examination Emergency Strategy 姜 海 峰 指 导 教 师 姓 名 : 王 玉 琼 教 授 专 业 名 称 : 公 共
4 38 1985 1990 1985 1990 2. 40 2. 23 2002 2. 04 2007 1. 89 2012 1. 86 2013 1981 2. 61 1985 1989 2. 29 1993 1. 5 ~ 1. 6 2013 1. 7 2014 2010 2013 2011 2
 38 3 2014 5 Vol. 38 No. 3 May 2014 3 Population Research * 2013 2013 1. 93 1. 84 1. 98 2. 01 1. 79 1. 83 1. 95 1. 81 104 1 2 128 102 59. 0% 20. 5% 12. 1% 8. 4% 100081 Fertility Intention of Rural and Urban
% % % % % % ~
 1001-5558 2015 03-0021-16 2010 C91 A 2014 5 2010 N. W. Journal of Ethnology 2015 3 86 2015.No.3 Total No.86 2010 2010 2181.58 882.99 40.47% 1298.59 59.53% 2013 2232.78 847.29 37.95% 1385.49 62.05% 1990
1 引言
 中 国 经 济 改 革 研 究 基 金 会 委 托 课 题 能 力 密 集 型 合 作 医 疗 制 度 的 自 动 运 行 机 制 中 国 农 村 基 本 医 疗 保 障 制 度 的 现 状 与 发 展 的 研 究 课 题 主 持 人 程 漱 兰 中 国 人 民 大 学 农 业 与 农 村 发 展 学 院 课 题 组 2004 年 4 月 2005 年 4 月 1 课 题 组 成 员 名 单 主 持
Public Projects A Thesis Submitted to Department of Construction Engineering National Kaohsiung First University of Science and Technology In Partial
 Public Projects A Thesis Submitted to Department of Construction Engineering National Kaohsiung First University of Science and Technology In Partial Fulfillment of the Requirements For the Degree of Master
窑 374窑 国 际 生 殖 健 康 / 计 划 生 育 杂 志 2013 年 9 月 第 32 卷 第 5 期 JInt Reprod Health 蛐 Fam Plan,September 2013 熏 Vol. 32 熏 No 统 计 学 方 法 数 据 审 核 后 录 入 计
 国 际 生 殖 健 康 / 计 划 生 育 杂 志 2013 年 9 月 第 32 卷 第 5 期 JInt Reprod Health 蛐 Fam Plan,September 2013 熏 Vol. 32 熏 No.5 窑 373窑 生 殖 健 康 与 辅 助 生 殖 技 术 论 著 * 陆 卫 群 朱 江 吟 摘 要 目 的 : 了 解 贵 州 省 少 数 民 族 性 生 活 现 状 并 分
中國文化大學政治學研究所
 中 國 文 化 大 學 社 會 科 學 院 政 治 學 系 碩 士 論 文 Department of Political Science College of Social Sciences Chinese Culture University Master Thesis 台 灣 中 小 企 業 赴 大 陸 投 資 風 險 及 其 因 應 之 道 Investment Risks and its
1556 地 理 科 学 进 展 30 卷 他 关 于 农 村 住 房 结 构 与 抗 震 性 能 的 研 究, 则 多 是 从 工 程 抗 灾 的 角 度, 研 究 某 种 构 造 类 型 的 房 屋, 力 图 找 到 传 统 房 屋 的 结 构 失 误 和 新 建 房 屋 中 存 在 的 问 [
 第 30 卷 第 12 期 2011 年 12 月 地 理 科 学 进 展 PROGRESS IN GEOGRAPHY Vol.30, No.12 Dec., 2012 中 国 农 村 地 区 住 房 结 构 的 区 域 差 异 及 其 影 响 因 素 1, 2, 李 方 一 3 1,, 高 晓 路 2 2, 王 英 杰 (1. 中 国 科 学 院 区 域 可 持 续 发 展 分 析 与 模 拟 重
南華大學數位論文
 南 華 大 學 教 育 社 會 學 研 究 所 碩 士 論 文 高 職 智 能 障 礙 學 生 性 教 育 課 程 之 行 動 研 究 Action research of sex education for students with intellectual disability in a vocational school 研 究 生 : 蘇 淑 惠 指 導 教 授 : 林 昱 瑄 博 士 中
内容 Outline 1 中国机动化进程及其影响 Motorization and its effects 2 中国道路交通安全发展及形势 Road traffic development and trends 3 中国客车特大事故特征及政策回顾 Fatal crash analysis and s
 城市交通发展中的道路安全研讨会 唐琤琤博士/研究员 张建军副研究员 胡晗副研究员 交通运输部公路科学研究院 交通运输部公路交通安全工程研究中心 交通运输部公路交通安全技术行业重点实验室 2013年12月19日 内容 Outline 1 中国机动化进程及其影响 Motorization and its effects 2 中国道路交通安全发展及形势 Road traffic development and
 学 校 编 码 :10384 分 类 号 密 级 学 号 :X2007155130 UDC 厦 门 怡 福 养 生 健 康 管 理 有 限 公 司 创 业 计 划 王 韬 指 导 教 师 姓 名 : 郭 霖 教 授 厦 门 大 学 硕 士 学 位 论 文 厦 门 怡 福 养 生 健 康 管 理 有 限 公 司 创 业 计 划 A Business Plan for Xiamen Eve Health
2015医学版第六期
 第 4 卷 第 6 期 205 年 2 月 Journal of Lanzhou University(Medical Sciences) Vol.4 No.6 Dec. 205 文 章 编 号 :000-282 (205) 06-0054-05 金 昌 队 列 人 群 代 谢 综 合 征 率 及 组 分 分 析 彭 峥, 白 亚 娜, 王 凤 杰 2, 李 娟 生, 李 海 燕 2, 刘 燕 青,
文章
 农 学 学 报 206,6():7-2 Journal of Agriculture www.caaj.org 县 域 经 济 主 观 评 估 指 标 体 系 与 满 意 度 评 估 研 究 以 烟 台 市 为 例 齐 萍 萍, 郭 晓 月, 于 立 云 2, 李 青 ( 中 国 农 业 大 学 烟 台 研 究 院, 山 东 烟 台 264670; 2 山 东 省 市 诸 由 观 镇 人 民 政 府,
电 话 随 访 对 初 产 妇 产 褥 期 母 乳 喂 养 行 为 及 意 向 的 影 响 The effect of telephone follow-up on breastfeeding behaviors and intentions of new mothers during the po
 ( 医 学 部 ) 在 职 人 员 申 请 硕 士 学 位 论 文 论 文 题 目 : 电 话 随 访 对 初 产 妇 产 褥 期 母 乳 喂 养 行 为 及 意 向 的 影 响 学 院 ( 医 院 所 ): 北 京 大 学 护 理 学 院 学 科 专 业 : 护 理 学 申 请 人 姓 名 : 导 师 姓 名 职 称 : 陆 虹 副 教 授 完 成 时 间 : 二 O 一 O 年 五 月 电 话
WTO
 10384 200015128 UDC Exploration on Design of CIB s Human Resources System in the New Stage (MBA) 2004 2004 2 3 2004 3 2 0 0 4 2 WTO Abstract Abstract With the rapid development of the high and new technique
a b
 38 3 2014 5 Vol. 38 No. 3 May 2014 55 Population Research + + 3 100038 A Study on Implementation of Residence Permit System Based on Three Local Cases of Shanghai Chengdu and Zhengzhou Wang Yang Abstract
國立中山大學學位典藏
 Schoenfeld Sternberg Krutetskii I II An analysis of Mathematics Problem-solving Processes of Gifted Primary School Children with General Intelligent Ability Huang Chia-Chieh Institute of Education National
國立中山大學學位論文典藏.PDF
 ( ) 2-1 p33 3-1 p78 3-2 p79 3-3 p80 3-4 p90 4-1 p95 4-2 p97 4-3 p100 4-4 p103 4-5 p105 4-6 p107 4-7 p108 4-8 p108 4-9 p112 4-10 p114 4-11 p117 4-12 p119 4-13 p121 4-14 p123 4-15 p124 4-16 p131 4-17 p133
受訪者編號:
 台 灣 社 會 變 遷 基 本 調 查 計 畫 第 六 期 第 四 次 調 查 計 畫 執 行 報 告 傅 仰 止 章 英 華 杜 素 豪 主 編 廖 培 珊 計 畫 編 號 :NSC 102-2420-H-001-007-SS2 中 央 研 究 院 社 會 學 研 究 所 二 一 四 年 三 月 參 與 教 授 傅 仰 止 計 畫 主 持 人 中 央 研 究 院 社 會 學 研 究 所 研 究 員
% % 99% Sautman B. Preferential Policies for Ethnic Minorities in China The Case
 1001-5558 2015 03-0037-11 2000 2010 C95 DOI:10.16486/j.cnki.62-1035/d.2015.03.005 A 1 2014 14CRK014 2013 13SHC012 1 47 2181 N. W. Journal of Ethnology 2015 3 86 2015.No.3 Total No.86 20 70 122000 2007
has become a rarity. In other words, the water resources that supply the needs in Taiwan depend crucially on the reservoirs built at least more than t
 臺 灣 水 利 第 64 卷 第 1 期 民 國 105 年 3 月 出 版 Taiwan Water Conservancy Vol. 64, No. 1, March 2016 論 台 灣 水 資 源 開 發 的 必 要 性 The Essentiality of Water Resource Development in Taiwan * 虞 國 興 GWO-HSING YU 淡 江 大 學
 A Study on the Relationships of the Co-construction Contract A Study on the Relationships of the Co-Construction Contract ( ) ABSTRACT Co-constructio in the real estate development, holds the quite
D A
 2015 4 D822.333 A 0452 8832 2015 4 0014-12 14 The Second ASEAN Regional Forum: The ASEAN Regional Forum, A Concept Paper, in ASEAN Regional Forum Documents Series 1994-2006, ASEAN Secretariat, Jakarta,
I
 National Taiwan University of Physical Education and Sport - The Research of the Development of Grassroots Baseball in Taichung City--A Case Study of Li-Sing Elementary School Team 1 0 2 7 - 273 0 20 I
國家圖書館典藏電子全文
 A feasibility study of the Crisis Management Warning System in the River Example of Keelung River i Recently, because of the over development in the urban area and the natural geological nature, people
2015年4月11日雅思阅读预测机经(新东方版)
") 剑 桥 雅 思 10 第 一 时 间 解 析 阅 读 部 分 1 剑 桥 雅 思 10 整 体 内 容 统 计 2 剑 桥 雅 思 10 话 题 类 型 从 以 上 统 计 可 以 看 出, 雅 思 阅 读 的 考 试 话 题 一 直 广 泛 多 样 而 题 型 则 稳 中 有 变 以 剑 桥 10 的 test 4 为 例 出 现 的 三 篇 文 章 分 别 是 自 然 类, 心 理 研 究 类,
剑 桥 雅 思 10 第 一 时 间 解 析 阅 读 部 分 1 剑 桥 雅 思 10 整 体 内 容 统 计 2 剑 桥 雅 思 10 话 题 类 型 从 以 上 统 计 可 以 看 出, 雅 思 阅 读 的 考 试 话 题 一 直 广 泛 多 样 而 题 型 则 稳 中 有 变 以 剑 桥 10 的 test 4 为 例 出 现 的 三 篇 文 章 分 别 是 自 然 类, 心 理 研 究 类,
%
 GDP 80% Logistic Beckmann 2006 2007 2010 2000 2013 80% 90% 2015 23 2017. 2 50% 200424 1. 1 2 24 2. 1 2 3 1 2 1 2 25 2017. 2 2008 2012 2006 2015 1 1 1 2 1 2015 136840 136812 136826 141100 139456 136974
 A Study on Grading and Sequencing of Senses of Grade-A Polysemous Adjectives in A Syllabus of Graded Vocabulary for Chinese Proficiency 2002 I II Abstract ublished in 1992, A Syllabus of Graded Vocabulary
既 設 建 築 物 汙 水 處 理 設 施 生 化 需 氧 量 三 O 化 學 需 氧 量 一 OO 流 量 大 於 二 五 O 立 方 公 尺 / 日 懸 浮 固 體 三 O 大 腸 桿 菌 群 二 OO OOO 生 化 需 氧 量 五 O 既 設 建 築 物 指 中 華 民 國 九 化 學 需
 台 灣 基 層 透 析 協 會 本 會 宗 旨 : 關 懷 透 析 病 患, 提 升 透 析 品 質, 維 護 透 析 診 所 與 病 患 的 權 益, 最 新 消 息 : 協 助 政 府 制 定 相 關 醫 療 政 策 及 推 行 健 康 保 險 制 度 105 年 6 月 1 日, 腎 臟 醫 學 會 林 元 灝 秘 書 長 和 基 層 透 析 協 會 顏 大 翔 秘 書 長 至 劉 建 國 立
<4D6963726F736F667420576F7264202D20A46AA4AFACECA7DEA46ABEC7B1D0AE76ACE3A873AD70B565A6A8AA47B3F8A769A4AFACE33938303637>
 大 仁 科 技 大 學 教 師 研 究 計 畫 成 果 報 告 長 期 照 護 中 心 之 室 內 空 氣 品 質 評 估 計 畫 編 號 : 仁 研 9867 執 行 期 限 :98 年 1 月 1 日 至 98 年 12 月 31 日 主 持 人 : 馮 靜 安 執 行 單 位 : 職 業 安 全 衛 生 系 ( 所 ) E-Mail:cafeng@mail.tajen.edu.tw 一 中 文
2005 3,? :; ;, ;,,,,,,1 % %,,,,, 1 %,,,, : () ;, ;,,,,,,,,,,,,, (2004) ( GBΠT ) 16 (2004), (2004) 47
 ;, ;,,,,,,,,,,,,, (2004) ( GBΠT ) 16 (2004), (2004) 47") : 3 ( 100836) :,, : :,,,,,,,,,,, ; (),,,,,??,??,,?,? 1982 1995,?,,?, 3 (2004) (Harry X. Wu) ;(:Measuring Output of Service Sector in China ; :16913107) (:; :70273058), 46 2005 3,? :; ;, ;,,,,,,1 % 1987
: 3 ( 100836) :,, : :,,,,,,,,,,, ; (),,,,,??,??,,?,? 1982 1995,?,,?, 3 (2004) (Harry X. Wu) ;(:Measuring Output of Service Sector in China ; :16913107) (:; :70273058), 46 2005 3,? :; ;, ;,,,,,,1 % 1987
國立中山大學學位論文典藏
 I II III IV The theories of leadership seldom explain the difference of male leaders and female leaders. Instead of the assumption that the leaders leading traits and leading styles of two sexes are the
居家式保母之嬰幼兒健康照護知能研究
 國 立 臺 北 護 理 健 康 大 學 嬰 幼 兒 保 育 系 碩 士 論 文 GRADUATE PROGRAM OF INFANT AND CHILD CARE DEPARTMENT NATIONAL TAIPEI UNIVERSITY OF NURSING AND HEALTH SCIENCES 指 導 教 授 段 慧 瑩 博 士 Advisor: Dr. Duan, Hui-Ying 居 家
<AE48B0F2C2E5C0F82DB2C432A8F7B2C432B4C12E706466>
 992 2 1 1 2 2 2 IDS 96 IDS IDS IDS IDS 596 1 198 12 31699 1 199 9 30 250401 272/274 B070.2 070.3C070.51 070.54 070.415 277HbA1C39~55%2 60HbA1c
 A study on the Fire Safety of Interior Finishes: Residential Buildings in Kaohsiung City taken as Examples between the interior design of safety and skill tests of Scholastic. A Thesis Submitted to Institute
天 主 教 輔 仁 大 學 社 會 學 系 學 士 論 文 百 善 孝 為 先? 奉 養 父 母 與 接 受 子 女 奉 養 之 態 度 及 影 響 因 素 : 跨 時 趨 勢 分 析 Changes in attitude toward adult children's responsibilit
 天 主 教 輔 仁 大 學 社 會 學 系 學 士 論 文 指 導 老 師 : 翁 志 遠 百 善 孝 為 先? 奉 養 父 母 與 接 受 子 女 奉 養 之 態 度 及 影 響 因 素 : 跨 時 趨 勢 分 析 Changes in attitude toward adult children's responsibility to financially support and to live
, 12 2,, 6486 22372 ( IARC) / ( IACR) 41528 (CIFC), 1993 1997 89489 31307,,, 1, 1996 1997 2, 1993 1997 5 ; + 4, 19931997, ( 19961997 ) ; () 19931997 1
 / ( IACR) 41528 (CIFC), 1993 1997 89489 31307,,, 1, 1996 1997 2, 1993 1997 5 ; + 4, 19931997, ( 19961997 ) ; () 19931997 1") 12 1993 1997 1, 2, 1, 1 3, (1., 100021 ;2., 100044 ;3., 100021) :[ ], [ ] /, 12 1993 1997 [ ], 12 108 915 759, 230 024, 161 602 88 %, 0. 578,,,,12 14/ 10 21/ 10 11/ 10 15/ 10 ; 169. 3/ 10 359. 7/ 10 48.
12 1993 1997 1, 2, 1, 1 3, (1., 100021 ;2., 100044 ;3., 100021) :[ ], [ ] /, 12 1993 1997 [ ], 12 108 915 759, 230 024, 161 602 88 %, 0. 578,,,,12 14/ 10 21/ 10 11/ 10 15/ 10 ; 169. 3/ 10 359. 7/ 10 48.
UDC The Policy Risk and Prevention in Chinese Securities Market
 10384 200106013 UDC The Policy Risk and Prevention in Chinese Securities Market 2004 5 2004 2004 2004 5 : Abstract Many scholars have discussed the question about the influence of the policy on Chinese
國家圖書館典藏電子全文
 A Study on the Job Stress and the Ways of Coping for the Director of Elementary School in the Middle Area of Taiwan Abstract This study aims at probing the subject current status as related to stress and
計畫編號:DOH94-DC-2027
 1 : : : : : : 2 4 5 6 7 3 37 4 5 6 The purpose of this study was to understand the distribution of sex industry. To establish channel of HIV education by cooperate with public health bureau and reduces
GDP = + + SNA
 许宪春 GDP GDP 0086 4 GDP = + + SNA 993 008 5 03 GDP GDP = + + = + + + + - GDP GDP GDP GDP GDP = + + - + - = + + + 3 6 3 4 5 3 4 5 008 38 0 5 0 3 008 SNA European Commission, International Monetary Fund,
% 82. 8% You & Kobayashi % 2007 %
 202 2 * 5. 6 995 2008 0 2008 28% Meng 2003 2000 2009 9. 4% 47% 200 % 2% 20% 50% Gruber & Yelowitz 999 Engen & Gruber 200 Chou et al. 2003 200 200 200 Brown et al. 200 2003 2003 2006 2006 * 00084 wubzh@
國民健康狀況是分配醫療資源及訂定全國健康目標之主要依據,更是衡量一個國家發展概況的重要指標之一
 89 5 1 212 312 412~19 520~65 1 30 CDC, 1998 1957 1994 89 1 2 3 1994 3,814 15,000 1995 1989 4,049 60 1997 2 1980 1998 1956 2000 2000 3 (computer-assisted telephone interviewing, CATI) (computer-assisted
Microsoft Word - 4羅筱芬.doc
 康 寧 學 報 7:97-117(2005) 97 南 港 軟 體 園 區 員 工 自 覺 健 康 狀 態 健 康 行 為 與 健 康 促 進 需 求 羅 筱 芬 * 劉 純 蓉 ** 蔡 春 美 *** 潘 婉 琳 * 摘 要 本 研 究 旨 在 瞭 解 南 港 軟 體 園 區 員 工 自 覺 健 康 狀 態 健 康 行 為 與 健 康 促 進 需 求 以 自 擬 問 卷 對 南 港 軟 體 園
南華大學數位論文
 -- Managing Traditional Temples A Case Study of Representative Temples in CHIA-YI i Abstract This research used the methodology of field study historical comparative research, and qualitative interview
Microsoft PowerPoint - Session 02 _TUS 2008-China2.ppt [Compatibility Mode]
![Microsoft PowerPoint - Session 02 _TUS 2008-China2.ppt [Compatibility Mode]](/thumbs/84/90869888.jpg "Microsoft PowerPoint - Session 02 _TUS 2008-China2.ppt [Compatibility Mode]") 2008 TIME USE SURVEY IN CHINA NATIONAL BUREAU OF STATISTICS, CHINA Gender Statistics in China China's gender statistics was founded in 1995, after the Fourth World Conference on Women in Beijing. Since
2008 TIME USE SURVEY IN CHINA NATIONAL BUREAU OF STATISTICS, CHINA Gender Statistics in China China's gender statistics was founded in 1995, after the Fourth World Conference on Women in Beijing. Since
壹、前言
 DOH93-DC-1116 93 3 1 93 12 31 ... 1... 4... 6... 7... 8... 9... 13... 13 ()... 13 ()... 14 ()... 14... 16... 16... 16... 17... 18 1 ... 19... 24... 27... 29... 31... 31... 33... 34... 35... 36... 36 ()...
1505.indd
 上 海 市 孙 中 山 宋 庆 龄 文 物 管 理 委 员 会 上 海 宋 庆 龄 研 究 会 主 办 2015.05 总 第 148 期 图 片 新 闻 2015 年 9 月 22 日, 由 上 海 孙 中 山 故 居 纪 念 馆 台 湾 辅 仁 大 学 和 台 湾 图 书 馆 联 合 举 办 的 世 纪 姻 缘 纪 念 孙 中 山 先 生 逝 世 九 十 周 年 及 其 革 命 历 程 特 展
東方設計學院文化創意設計研究所
 東 方 設 計 學 院 文 化 創 意 設 計 研 究 所 碩 士 學 位 論 文 應 用 德 爾 菲 法 建 立 社 區 業 餘 油 畫 課 程 之 探 討 - 以 高 雄 市 湖 內 區 為 例 指 導 教 授 : 薛 淞 林 教 授 研 究 生 : 賴 秀 紅 中 華 民 國 一 o 四 年 一 月 東 方 設 計 學 院 文 化 創 意 設 計 研 究 所 碩 士 學 位 論 文 Graduate
untitled
 联 合 国 A/HRC/19/59/Add.1 大 会 Distr.: General 20 January 2012 Chinese Original: English 人 权 理 事 会 第 十 九 届 会 议 议 程 项 目 3 增 进 和 保 护 所 有 人 权 公 民 权 利 政 治 权 利 经 济 社 会 和 文 化 权 利, 包 括 发 展 权 内 容 提 要 食 物 权 问 题 特
IPCC CO (IPCC2006) 1 : = ( 1) 1 (kj/kg) (kgc/gj) (tc/t)
 1 : = ( 1) 1 (kj/kg) (kgc/gj) (tc/t)") 2011 5 5 (278 ) China Industrial Economics May 2011 No.5 1 12 (1. 100005; 2. 066004) [ ] : ; ; : ; ; [ ] ; ; ; [ ]F290 [ ]A [ ]1006-480X(2011)05-0047-11 2008 CO 2 ( ) (2009) (GDP) (Binhocker et al. 2008)
2011 5 5 (278 ) China Industrial Economics May 2011 No.5 1 12 (1. 100005; 2. 066004) [ ] : ; ; : ; ; [ ] ; ; ; [ ]F290 [ ]A [ ]1006-480X(2011)05-0047-11 2008 CO 2 ( ) (2009) (GDP) (Binhocker et al. 2008)
Vol. 14 No Λ fl 2fl y1) % % % % % 201
 % % % % % 201") Vol. 14 No. 2 2005 249 259 Λ1 1961 1fl 2fl 1 1970 1961 1973 2 1973 1980 1990 199930 y1) 2010 54 5.6% 2025 104 4.5% 2000 1.75% 2001 1.5% 1995 7.1% 2010 11% 2025 17% 2.5 1 Λ1 700-0865 6-20 249 250 1 11 437
Vol. 14 No. 2 2005 249 259 Λ1 1961 1fl 2fl 1 1970 1961 1973 2 1973 1980 1990 199930 y1) 2010 54 5.6% 2025 104 4.5% 2000 1.75% 2001 1.5% 1995 7.1% 2010 11% 2025 17% 2.5 1 Λ1 700-0865 6-20 249 250 1 11 437
新能源汽车蓝皮书
 Reprint UCD-ITS-RP-16-23 A Comparison of Plug-in Electric Vehicle Markets Between China and the U.S. Based on Surveys Chapter in Blue Book of New Energy Vehicles 2016, Social Sciences Academic Press (In
9330.doc
 The research of the ecotourism operated by the cooperative operating system in northern Tapajen Mountain The research of the ecotourism operated by the cooperative operating system in northern Tapajen
2008 Nankai Business Review 61
 150 5 * 71272026 60 2008 Nankai Business Review 61 / 62 Nankai Business Review 63 64 Nankai Business Review 65 66 Nankai Business Review 67 68 Nankai Business Review 69 Mechanism of Luxury Brands Formation
前 言 一 場 交 換 學 生 的 夢, 夢 想 不 只 是 敢 夢, 而 是 也 要 敢 去 實 踐 為 期 一 年 的 交 換 學 生 生 涯, 說 長 不 長, 說 短 不 短 再 長 的 路, 一 步 步 也 能 走 完 ; 再 短 的 路, 不 踏 出 起 步 就 無 法 到 達 這 次
 壹 教 育 部 獎 助 國 內 大 學 校 院 選 送 優 秀 學 生 出 國 研 修 之 留 學 生 成 果 報 告 書 奧 地 利 約 翰 克 卜 勒 大 學 (JKU) 留 學 心 得 原 就 讀 學 校 / 科 系 / 年 級 : 長 榮 大 學 / 財 務 金 融 學 系 / 四 年 級 獲 獎 生 姓 名 : 賴 欣 怡 研 修 國 家 : 奧 地 利 研 修 學 校 : 約 翰 克 普
南華大學數位論文
 南 華 大 學 休 閒 產 業 經 濟 學 系 碩 士 班 碩 士 論 文 來 台 旅 客 之 住 宿 類 型 選 擇 與 滿 意 度 研 究 A Study on Foreign Tourists Accommodation Choice And Satisfaction in Taiwan 指 導 教 授 : 黃 瓊 玉 博 士 張 鐸 瀚 博 士 研 究 生 : 周 百 苓 中 華 民 國 102
WTO
 10384 X0115018 UDC MBA 2004 5 14 2004 6 1 WTO 2004 2006 7 2 Abstract According to the promise after our country enter into WTO, our country will open the readymade oil retail market in the end of 2004
03 年 8 月 Vol.5 No.8 支 气 管 哮 喘 ( 简 称 哮 喘 ) 是 儿 童 时 期 最 常 见 的 慢 性 呼 吸 道 疾 病 之 一 近 年 来, 随 着 人 类 文 明 的 发 展 社 会 化 进 程 的 加 快 经 济 水 平 的 提 高 和 科 技 的 进 步, 环 境
 是 儿 童 时 期 最 常 见 的 慢 性 呼 吸 道 疾 病 之 一 近 年 来, 随 着 人 类 文 明 的 发 展 社 会 化 进 程 的 加 快 经 济 水 平 的 提 高 和 科 技 的 进 步, 环 境") 03 年 8 月 Vol.5 No.8 DOI:0.7499/j.issn.008-8830.03.08.003 论 著 临 床 研 究 成 都 地 区 0~4 岁 城 乡 儿 童 哮 喘 流 行 病 学 调 查 对 比 分 析 李 敏 张 琼 时 维 娟 李 兰 李 艳 庞 英 姚 兵 蒋 虹 (. 四 川 省 医 学 科 学 院 / 四 川 省 人 民 医 院 儿 科, 四 川 成 都 6007;.
03 年 8 月 Vol.5 No.8 DOI:0.7499/j.issn.008-8830.03.08.003 论 著 临 床 研 究 成 都 地 区 0~4 岁 城 乡 儿 童 哮 喘 流 行 病 学 调 查 对 比 分 析 李 敏 张 琼 时 维 娟 李 兰 李 艳 庞 英 姚 兵 蒋 虹 (. 四 川 省 医 学 科 学 院 / 四 川 省 人 民 医 院 儿 科, 四 川 成 都 6007;.
chr82-06DuanW.hwp
 上 海 小 三 線 建 設 在 縣 域 分 佈 特 點 的 歷 史 地 理 考 察 - 以 安 徽 省 寧 國 縣 为 例 - 段 偉 ( 中 國 復 旦 大 學 ) Ⅰ. 序 言 Ⅱ. 上 海 小 三 線 建 設 的 選 址 與 寧 國 縣 的 區 位 Ⅲ. 小 三 線 企 事 業 單 位 在 寧 國 縣 的 分 佈 Ⅳ. 改 造 後 的 寧 國 縣 小 三 線 建 設 與 城 鎮 發 展 Ⅴ.
Untitiled
 中 华 流 行 病 学 杂 志 2014 年 12 月 第 35 卷 第 12 期 1343 现 场 调 查 浙 江 省 2013 年 成 人 吸 烟 及 被 动 吸 烟 现 状 调 查 徐 越 徐 水 洋 吴 青 青 王 磊 刘 禾 赵 玉 遂 吕 巧 红 摘 要 目 的 描 述 2013 年 浙 江 省 成 人 吸 烟 戒 烟 和 被 动 吸 烟 的 流 行 水 平 及 其 不 同 教 育 水
2005 5,,,,,,,,,,,,,,,,, , , 2174, 7014 %, % 4, 1961, ,30, 30,, 4,1976,627,,,,, 3 (1993,12 ),, 2
,, 2") 3,,,,,, 1872,,,, 3 2004 ( 04BZS030),, 1 2005 5,,,,,,,,,,,,,,,,, 1928 716,1935 6 2682 1928 2 1935 6 1966, 2174, 7014 %, 94137 % 4, 1961, 59 1929,30, 30,, 4,1976,627,,,,, 3 (1993,12 ),, 2 , :,,,, :,,,,,,
3,,,,,, 1872,,,, 3 2004 ( 04BZS030),, 1 2005 5,,,,,,,,,,,,,,,,, 1928 716,1935 6 2682 1928 2 1935 6 1966, 2174, 7014 %, 94137 % 4, 1961, 59 1929,30, 30,, 4,1976,627,,,,, 3 (1993,12 ),, 2 , :,,,, :,,,,,,
黑面琵鷺2015
 PG10402-0124 104-01-01 104 年 度 台 江 國 家 公 園 黑 面 琵 鷺 族 群 生 態 研 究 及 其 棲 地 經 營 管 理 計 畫 台 江 國 家 公 園 管 理 處 委 託 研 究 報 告 (104 年 ) ( 本 報 告 內 容 及 建 議, 純 屬 研 究 小 組 意 見, 不 代 表 本 機 關 意 見 ) 中 華 民 國 104 年 12 月 PG10402-0124
摘 要 摘 要 隨 著 自 由 行 的 實 施, 越 來 越 多 的 內 地 旅 客 進 入 澳 門, 有 效 地 帶 動 了 澳 門 旅 遊 博 彩 酒 店 和 零 售 等 行 業 的 發 展 然 而, 伴 隨 旅 客 數 量 的 增 加, 旅 遊 糾 紛 也 層 出 不 窮, 這 無 疑 為 以
 題 目 : 隨 團 訪 澳 內 地 旅 客 與 澳 門 旅 遊 業 者 對 旅 遊 相 關 法 律 的 認 知 ---- 從 旅 遊 糾 紛 的 角 度 出 發 Title:Study on Cognition of Laws on Tourism Dispute between Package-tour Visitors from Mainland China and Local Tourist
 20 5 Vol.20 No.5 2018 9 Journal of Shijiazhuang University Sep. 2018 1 2 1 1. 100029 2. 063000 F752.5 A 1673-19722018 05-0073-12 DOI:10.13573/j.cnki.sjzxyxb.2018.05.014 2017 2 [1]25 [2] [3]12 2018-06-02
601988 2010 040 113001 2010 8 26 2010 8 12 2010 8 26 15 15 2010 15 0 0 15 0 0 6035 20022007 20012002 19992001 200720081974 1999 2010 20082008 2000 197
 BANK OF CHINA LIMITED 3988 2010 8 26 ** ** *** # Alberto TOGNI # # # * # 1 601988 2010 040 113001 2010 8 26 2010 8 12 2010 8 26 15 15 2010 15 0 0 15 0 0 6035 20022007 20012002 19992001 200720081974 1999
 10384 X0115071 UDC The Research For The Actuality And Development Stratagem Of The China Securities Investment Fund (MBA) 2003 11 2003 12 2003 12 2 0 0 3 11 100 1991, WTO Abstract Abstract The Securities
1. Since the latest world financial crisis, Chinese government has been implementing expansionary active fiscal policies in response to declining econ
 China s Recent Experiences for Fiscal Policy Under Demographic Changes and Uncertainties 1. Since the latest world financial crisis, Chinese government has been implementing expansionary active fiscal
~ 10 2 P Y i t = my i t W Y i t 1000 PY i t Y t i W Y i t t i m Y i t t i 15 ~ 49 1 Y Y Y 15 ~ j j t j t = j P i t i = 15 P n i t n Y
 * 35 4 2011 7 Vol. 35 No. 4 July 2011 3 Population Research 1950 ~ 1981 The Estimation Method and Its Application of Cohort Age - specific Fertility Rates Wang Gongzhou Hu Yaoling Abstract Based on the
致 谢 本 人 自 2008 年 6 月 从 上 海 外 国 语 大 学 毕 业 之 后, 于 2010 年 3 月 再 次 进 入 上 外, 非 常 有 幸 成 为 汉 语 国 际 教 育 专 业 的 研 究 生 回 顾 三 年 以 来 的 学 习 和 生 活, 顿 时 感 觉 这 段 时 间 也
 精 英 汉 语 和 新 实 用 汉 语 课 本 的 对 比 研 究 The Comparative Study of Jing Ying Chinese and The New Practical Chinese Textbook 专 业 : 届 别 : 姓 名 : 导 师 : 汉 语 国 际 教 育 2013 届 王 泉 玲 杨 金 华 1 致 谢 本 人 自 2008 年 6 月 从 上 海 外
擬稿
 立法會 CB(2)29/09-10(03) 號文件 2009 10 22 : 2. 2009 9 13 3. ( 59 ) () ( 59I ) ( ( 59AC ) ( 509 4. - 2 - ( ) ( 5. 50 6. ( ) 2003 2003 ( ) 7. ( ) VA 2 ( ) VA 20 12 8. ( ) ( ) 20 12 - 3-9. 20 12 50 12 10. 1 (
<4D6963726F736F667420576F7264202D20B169B74FC5EF2020A8E2A9A4B0EABB79B1D0ACECAED1A56AA8E5B8D6BA71BFEFBFFDA4A7ACE3A8732E646F63>
 國 立 臺 北 教 育 大 學 人 文 藝 術 學 院 語 文 與 創 作 學 系 語 文 教 學 碩 士 班 ( 暑 期 班 ) 碩 士 論 文 Master Program of Language Instruction ( Summer Program) Department of Language and Creative Writing College of Humanities and
The Graduate Institute of Taiwan Food Culture National Kaohsiung Hospitality College Thesis for the Master Degree A Study of Postpartum Recuperation t
 國 立 高 雄 餐 旅 學 院 台 灣 飲 食 文 化 產 業 研 究 所 The Graduate Institute of Taiwan Food Culture National Kaohsiung Hospitality College 碩 士 論 文 Thesis for the Master Degree 近 五 十 年 來 台 灣 閩 南 婦 女 產 後 月 內 飲 食 調 養 之 研
Oates U
 2018 3 94 233030 30 20002015 F061. 5 F062. 1 A 1671-9301 2018 03-0053-11 DOI:10.13269/j.cnki.ier.2018.03.005 1 1994 2018-02-22 2018-04-26 1981 13&ZD025 1708085MG172 KJ2018A0442 2017ZD003 53 2 3 4 5 Oates
地質調査研究報告/Bulletin of the Geological Survey of Japan
 Shigeru Suto, Takayuki Inomata, Hisashi Sasaki and Sakae Mukoyama (2007) Data base of the volcanic ash fall distribution map of Japan. Bull. Geol. Surv. Japan, vol. 58(9/10), p.261-321, 8 figs, 2 tables,
Microsoft Word - 24217010311110028谢雯雯.doc
 HUAZHONG AGRICULTURAL UNIVERSITY 硕 士 学 位 论 文 MASTER S DEGREE DISSERTATION 80 后 女 硕 士 生 择 偶 现 状 以 武 汉 市 七 所 高 校 为 例 POST-80S FEMALE POSTGRADUATE MATE SELECTION STATUS STUDY TAKE WUHAN SEVEN UNIVERSITIES
Microsoft Word - 11月電子報1130.doc
 發 行 人 : 楊 進 成 出 刊 日 期 2008 年 12 月 1 日, 第 38 期 第 1 頁 / 共 16 頁 封 面 圖 話 來 來 來, 來 葳 格 ; 玩 玩 玩, 玩 數 學 在 11 月 17 到 21 日 這 5 天 裡 每 天 一 個 題 目, 孩 子 們 依 據 不 同 年 段, 尋 找 屬 於 自 己 的 解 答, 這 些 數 學 題 目 和 校 園 情 境 緊 緊 結
南華大學數位論文
 I II Abstract This study aims at understanding and analysing the general situation and predicament of current educational development in Savigi tribe and probing the roles played by the school, the family
mm 400 mm 15 mm EOF mm/10a Fig. 1 Distributions
 7 2 2011 3 ADVANCES IN CLIMATE CHANGE RESEARCH Vol. 7 No. 2 March 2011 1673-1719 (2011) 02-0097-07 1961 2007 77 5 5 6 2 3 8 11 1980 1980 1990 2015 8 11 P426.6 A 7.86% 4 50 0.35 5 6 19 7 8 9 1 1906 2005
( 三 ) 產 業 實 習 組 撰 寫 赴 大 陸 產 業 實 習 構 想 與 規 劃 (1,000 字 ) 具 良 好 學 習 意 願 與 工 作 態 度 部 份 跨 國 企 業 需 具 備 外 語 能 力 五 研 習 課 程 * 參 見 附 件 二 六 獎 助 對 象 研 習 期 間 將 有 陸
 產 業 實 習 組 撰 寫 赴 大 陸 產 業 實 習 構 想 與 規 劃 (1,000 字 ) 具 良 好 學 習 意 願 與 工 作 態 度 部 份 跨 國 企 業 需 具 備 外 語 能 力 五 研 習 課 程 * 參 見 附 件 二 六 獎 助 對 象 研 習 期 間 將 有 陸") 2015 第 十 屆 兩 岸 暨 國 際 菁 英 蹲 點 獎 助 研 究 生 夏 令 營 一 活 動 主 旨 提 昇 臺 灣 暨 大 陸 研 究 專 業 水 準 強 化 兩 岸 學 術 交 流 與 產 業 對 話 2015 年 3 月 25 日 修 正 獎 助 兩 岸 與 國 際 菁 英, 赴 臺 灣 與 大 陸 進 行 學 術 研 究, 並 強 化 產 業 實 習 經 驗 與 創 業 能 力 二
2015 第 十 屆 兩 岸 暨 國 際 菁 英 蹲 點 獎 助 研 究 生 夏 令 營 一 活 動 主 旨 提 昇 臺 灣 暨 大 陸 研 究 專 業 水 準 強 化 兩 岸 學 術 交 流 與 產 業 對 話 2015 年 3 月 25 日 修 正 獎 助 兩 岸 與 國 際 菁 英, 赴 臺 灣 與 大 陸 進 行 學 術 研 究, 並 強 化 產 業 實 習 經 驗 與 創 業 能 力 二
: ( ),,
,,") Case Discussion: ( ), RN, ScD, MPH : 24,,,,,,, ( ) ) ( ), : ( ),, randomized controlled trial (RCT). minimization program,,,, : : ; Apgar score > 7 ;, : ; ; ; ; (BT180/min; 2, 83,50 (60.2%).,
Case Discussion: ( ), RN, ScD, MPH : 24,,,,,,, ( ) ) ( ), : ( ),, randomized controlled trial (RCT). minimization program,,,, : : ; Apgar score > 7 ;, : ; ; ; ; (BT180/min; 2, 83,50 (60.2%).,
(Microsoft Word - \262\263\250\245\260\36320131116_combined version-2)
") 眾 經 言 濟 堂 ::2014 施 政 報 告 諮 詢 市 民 提 問 1. 2. 3. 你 對 所 有 樓 謂 什 市 政 麼 之 經 方 辣 不 法 招 分 去, 可 幫 香 否 助 港 廢 殘 整 除 疾 體 人 經? 士 濟 需? 要 如 眼 有 望 可 中 投 國 入 大 一 方 些 向 金 發 錢 展 去 改 善 作 他 出 們 先 的 知 生 先 活 覺 完 善 法 制 人 才, 人
眾 經 言 濟 堂 ::2014 施 政 報 告 諮 詢 市 民 提 問 1. 2. 3. 你 對 所 有 樓 謂 什 市 政 麼 之 經 方 辣 不 法 招 分 去, 可 幫 香 否 助 港 廢 殘 整 除 疾 體 人 經? 士 濟 需? 要 如 眼 有 望 可 中 投 國 入 大 一 方 些 向 金 發 錢 展 去 改 善 作 他 出 們 先 的 知 生 先 活 覺 完 善 法 制 人 才, 人
Abstract Today, the structures of domestic bus industry have been changed greatly. Many manufacturers enter into the field because of its lower thresh
 SWOT 5 Abstract Today, the structures of domestic bus industry have been changed greatly. Many manufacturers enter into the field because of its lower threshold. All of these lead to aggravate drastically
<4D6963726F736F667420576F7264202D20BEDBC9B3B3C9CBFEA1AAA1AAC9CCBDADBDCCD3FDCEC4BCAF20A3A8D6D0A3A92E646F63>
 高 等 教 育 初 步 探 讨 高 等 学 校 党 委 书 记 和 校 长 的 岗 位 职 责 内 容 提 要 : 2003 年 出 版 的 高 等 教 育 杂 志, 几 乎 每 期 都 有 探 讨 高 等 学 校 党 委 领 导 下 的 校 长 分 工 负 责 制 的 文 章 我 以 为, 这 些 文 章 所 涉 及 的 中 心 问 题 是 高 等 学 校 党 委 书 记 和 校 长 谁 是 一
ITC China Supp_Chinese Mar29 Health Knowledge.indd
 中 国 吸 烟 者 和 非 吸 烟 者 的 健 康 知 识 与 风 险 认 识 :ITC 中 国 调 查 第 一 轮 调 查 结 果 Jilan Yang, 1 David Hammond, 1,2 Pete Driezen, 2 Geoffrey T Fong, 3,4 姜 垣 5 研 究 论 文 1 加 拿 大 滑 铁 卢 大 学 健 康 研 究 与 老 年 医 学 系 2 加 拿 大 滑 铁
II
 I II Research on the Development of Folk Sports in Taiwan With Rope-Jumping as the Main Subject Abstract The first national folk sports competition, held in Tainan city on Sep 9, 1976, established the