PowerPoint Presentation
|
|
|
- 懿 余
- 8 years ago
- Views:
Transcription
1 13. Linear Regression and Correlation 數 1
2 Outline Data: two continuous measurements on each subject Goal: study the relationship between the two variables PART I : correlation analysis Study the relationship between two continuous variables. Steps : Scatter diagram Correlation coefficient : Calculation, meaning, hypothesis testing PART II : linear regression Construct a linear equation between variables. Model building Model estimating : Confidence intervals and prediction intervals Model fitting: Strength of the linear association,coefficient of determination
3 Recall : In Ch.11 and 1, X : nominal variable. Ex. Gender(binary), brand(3-level) Y : response variable(cont. or binary). Ex. Score, success-failure, yield, Q : whether X and Y are correlated? A : If Y is continuous, comparing the population means of Y in the groups divided by X. Ex : 藍 綠 --Z-test, T-test, ANOVA F-test 3
4 Recall : In Ch.11 and 1, Q : whether X and Y are correlated? A : If X and Y are binary, compare the population proportions of Y in the two groups divided by X. Ex : 參 行 例 女 參 行 例 When sample sizes are large, Z-test is used. Q : How to determine the correlation if X and Y are both continuous? -- correlation and regression analysis! 4
5 Data : A sample of n sets of observation. There are k continuous variables measured in each observation. Example. Surveyed n=10 students, k=3 scores are recorded. Questions : any association between scores? 5
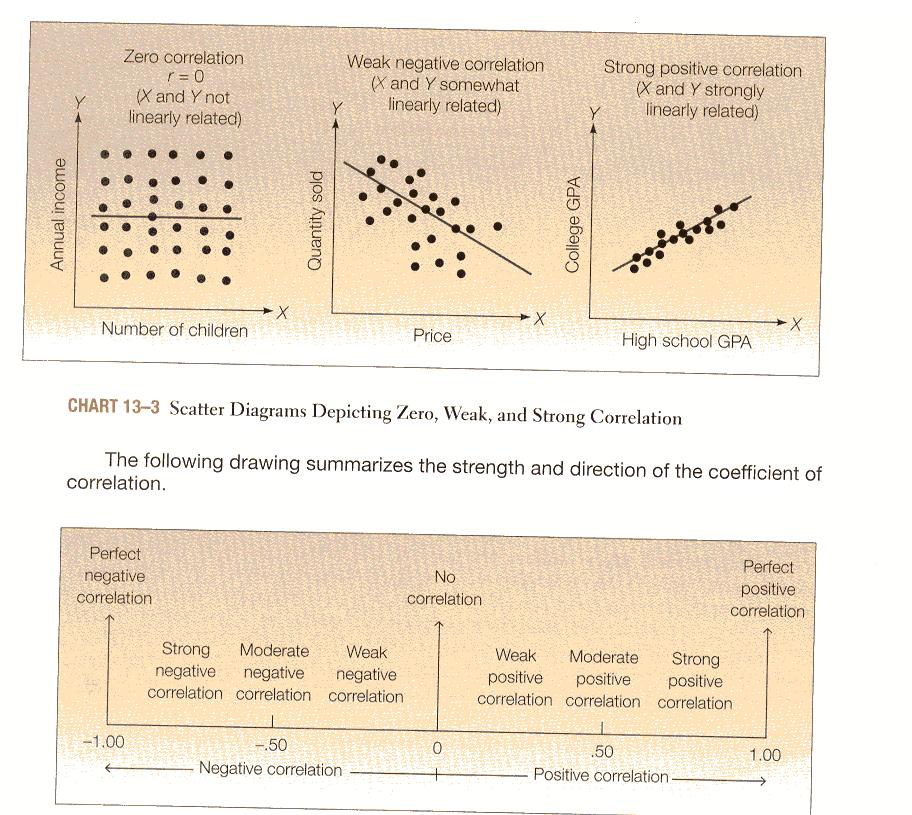
6 What is correlation analysis? Study the relationship between several continuous variables. Measure the strength of the association between variables. Correlation analysis consists : Step 1. Scatter diagram : Plot (X1, X) Step. Coefficient of correlation : 6
7 EXCEL Conclusion : 1. 不 率 0 行. 3. 7
8 Population coefficient of correlation, : A measure of the strength of the linear relationship between two variables. Definition: population correlation coefficient (x µ µ ρ = σ σ Estimation : sample correlation coefficient Sxy r = SS x y x )(y y)p(x, y) x y where S xy n (xi x)(yi y) xiyi nxy i= 1 i= 1 = = n 1 n 1 n n (xi x) (yi y) i= 1 i= 1 y S x =,S = n 1 n 1 n 8
 Strongly positive linear association : r 1 Strongly negative linear association : r -1")
9 Properties : -1 r 1 Positive linear association : r > 0 Negative linear association : r < 0 no linear relation : r 0 (! Other relation may exist) Strongly positive linear association : r 1 Strongly negative linear association : r -1 9
10 10
11 Why such definition? If there is a strongly positive linear association, when x is large, y is large, then we have a large positive value of Sxy. If there is a strongly negative linear association, when x is large, y is small, then we have a large negative value of Sxy. If there is no relation, when x is large, some y are large, some y are small, then Sxy 0, r 0. 11
12 EXCEL 欄 欄 欄 數 數 數 數 數 數 異數 異數 異數 度 度 度 數 數 數 1
13 EXCEL Conclusion : 1. 數 = 數 = 數 =
14 Recall in a single population with one variable : Population : N= subjects X=measurement =population mean H0 : = 0? Unknown! Random sampling Sample : n subjects X=observations calculation X =sample mean X 0 t/z= SE(X) -- a t/z-test!. 14
15 Now we have a single population with two variables : Population : N= subjects Measurements:(X, Y) =population coef. of correlation H0 : = 0? Unknown! Random sampling calculation r = sample coef. of correlation Sample : n subjects Observations: (X,Y) t r 0 = SE(r) -- a t-test! 15
16 Testing the significance of the correlation coefficient Testing the null hypothesis of no correlation : =0 Step 1. State the hypotheses H0 : no correlation v.s. H1: correlated H0 : = 0 v.s. H1 : 0 Step. Select the significance level 16
17 Step 3. Determine the test statistic r 0 r r n t = = = SE(r) (1 r ) /(n ) 1 r Note that under null hypothesis, t ~ t-distribution with d.f.=(n-) Step 4. Formulate the decision rule A two-sided test; A t-test; With significance level, H0 should be rejected if t > t /,n- or t <- t /,n- Step 5. Collect data, compute t-value, draw conclusion 17
18 Example. At =0.05, n=10, df=10-=8, t (0.05,8) =.306 Test 1 : ( v.s. ) H0 : 1= 0 v.s. H1 : 1 0 Since r1=0.033, n=10, r t = n = = 1 r1 1 (0.033) Since.306< t=0.093 <.306, H0 is not rejected. Conclusion : there is no sufficient evidence to reject the null hypothesis of no correlation. 18
19 Example. At =0.05, n=10, df=10-=8, t (0.05,8) =.306 Test : ( v.s. ) H0 : = 0 v.s. H1 : 0 Since r=0.7151, n=10, t = r n = = 1 r 1 (0.7151).89 Since t=.89>.306, H0 is rejected. Conclusion : there is sufficient evidence to reject the null hypothesis of no correlation. 19
20 Example. At =0.05, n=10, df=10-=8, t (0.05,8) =.306 Test 3: ( v.s. ) H0 : 3= 0 v.s. H1 : 3 0 Since r3=0.3755, n=10, r t = n = = 1 r3 1 (0.3755) 1.15 Since.306< t=1.15 <.306, H0 is not rejected. Conclusion : there is no sufficient evidence to reject the null hypothesis of no correlation. 0
21 ! A word of caution : for H0 of no correlation been rejected,! Only linear relationship between variables are ascertained.! Quadratic? Cubic?! No cause and effect ( ) is established.!!!?!! Spurious( ) correlations :! 來 數! 來 數量! 數 年 1
22 Variables : PART II. Linear Regression Analysis X=Independent variable(s), explanatory variable, predictor, 數, 數 Y=Dependent variable, response variable, 數, 數 To be predicted or estimated. Regression analysis : Develop an equation/function that allows us to estimate/predict Y based on X. Example. X= Y 若 60 數
23 ANOVA Regression Recall : In a one-way ANOVA AGE vs. INCOME The whole population are classified into three subpopulations by AGE A young-population. A middle-age-population. A senior-population The INCOMEs of all sub-populations are Normally distributed with same variance Research question: The mean INCOMEs, income,are the same? 3
24 ANOVA Regression Recall : In a simple linear regression model, (X) vs. (Y) The whole population are classified into many sub-populations by (X) X=0-population; X=1-population;..., X=100-population. The (Y) of all sub-populations are Normally distributed with same variance Research question: The mean s, Y, are the same? Establish the relationship between Y and X 4
25 Regression Model: (P449) 1. Given each value of X, there is a group of Ys. X X=60 Y= X=50 Y=. These Y values ~ normal distribution. At X=60, Y~ N( µ Y X = 60, σ ) At X=50, Y~ N(, σ ) µ Y X = 50 5
26 3. The means of these normal distributions is a linear function of x 數 X 數 數 X 數 µ Y x = α + βx Example ( ) Y = x 6
27 4. The standard deviations of these normal distributions are all the same. (independent with x) 異數 At X=60, Y~ At X=50, Y~ N( µ Y X = 60, σ ) N(, σ ) µ Y X = The observations (X 1, Y 1 ),,(X n,y n ) are statistically independent. 立 7
28 Y ~ N( α + βx, σ ) N( α + β x, σ 1 ) N( α + β x, ) N( α + βx3, σ σ ) µ Y x = α + βx 8
29 Practically, only a sample data is collected and α, β, σ are unknown P(y) " µ Y x = α + βx"? : observations 9

30 How to estimate the regression equation using a sample data? Y " µ Y x = α + βx"? : observations 30
31 Estimation of the model Observations : (X 1, Y 1 ),,(X n,y n ) Regression model : Y X=x~ N( µ Y x = α + βx, σ ) Regression equation : µ Y x = α + βx Estimation : α =? β =? σ =? 31
32 Let a, b be estimates of α,β Predicted equation : Y = a + b x, it could be a 1. predicted value of Y : Y Ex. 若 X=60 數 Y X=60? µ Y x. estimated value of Ex. X=60 數 µ = =? Y X 60? µ Y x 3

33 Estimation of α,β A possible equation! Many possible equations! 33
 (Y 3 1 i i i = + + = = 13 8 8 Y ') (Y 3 1 i i i = + + =")
34 34 observed Y; predicted Y Prediction error = Y-Y min imum 4 4 Y ') (Y 3 1 i i i = + + = = 44 6 Y ') (Y 3 1 i i i = + + = = Y ') (Y 3 1 i i i = + + = =
35 In the predicted equation, the intercept a =? The slope 率 b=? Least Squares estimates (LSE, ) a, b : Principle : find a regression equation which minimizes the sum of squared differences between the actual Y and the predicted Y min imize n i= 1 (Yi Y i ') 35
36 Formulae : Linear regression equation : Y = a + bx Estimated regression coefficients : b = S /S,a = Y bx xy x where S = (x x)(y y)/(n 1) = { xy nxy}/(n 1), xy S = (x x) /(n 1) = { x nx }/(n 1) x 36
37 Meaning of the estimated intercept, a a = Y at X=0. µ Y = The estimated value of X 0 when X=0. Example. X Y 零 金 0 零 金 = a The predicted value of Y when X=0. Example. X Y 零 金 若 0 零 金 a 0 不 數 X a Example. X= Y= X 不 0 a 37
38 a is an estimate of the true intercept. One may interest in testing H0 : =0. When =0, the equation passes through the origin( ), µ µ Y x Y x= 0 = βx = 0 38
39 Meaning of the estimated slope, b b = increment with unit change of x When there is one unit change in x, the increment/decrement in µ Y x Example. In previous case, if b=0., X 1 零 金 0. µ Y x 39
40 b is an estimate of the true slope. One is more interested in testing H0 : =0. When =0, the equation is a constant 數 and independent of X values, µ Y x = α,y ~ N( α, σ The distribution of Y is uncorrelated with X. X and Y are independent! ) P(y) Y µ Y x = α x1 x x3 X 40
41 Example. X= Y X Y mean s.d. variance S = ( xy nxy)/(n 1) xy = { (73.5)(70.)}/(10 1) = b= S /S xy x = / = a = y bx = = Ans. Y = X 41
42 EXCEL : 數 數 度 Model fitting 數 Model estimating 4
43 EXCEL : output 數 Note : The difference to previous calculation is due to rounding error. 數 a, b estimates of, SE(a), SE(b) t- testing the null hypothesis of =0, =0 t-value(a)=a/se(a), t-value(b)=b/se(b) p- corresponding p-values to t-value(a), t-value(b) p-value (a) =0.9511>0.05, not reject that =0 p-value (b) = 0.0<0.05, reject! 0 95% 95% confidence interval for, 43

44 After a, b are obtained, σ =? µ Y x = α + βx a + bx = Y' 44
45 The standard error of estimate : Variance σ : Dispersion of Y around the regression line The variation of the random error, Error = = : unobtainable Standard error of estimate : Use residuals to estimate error, Residual = = Y-Y : observable Standard error of estimate is defined by s y x (Y Y') = n n 1 (S n S where Sy : sample s.d. of Y, Sx : sample s.d. of X = Y µ Y x Y X b ) 45

46 The standard error of estimate : σ or S y x The random variation is unexplained by the regression line. Great random variation Small random variation 46
47 Example. X= Y : Y = X X Y Y-Y' Note : Residual = = Y-Y : observable Error = = Y µ Y x : unobtainable 47
48 Example. X= Y : Y = X s y x (Y Y') = n = = 16.9 = (n 1) (n ) (S y S x b ) = 9 8 ( (0.93) ) 16.3 The standard error of estimate is
49 EXCEL : 數 數 sy x 49

50 ESTIMATION & PREDICTION Confidence intervals and prediction intervals ESTIMATION: Q: At X=x, the mean value of Y, Point estimation, confidence interval µ Y = x? PREDICTION: Q:If an individual is drawn from the population of X=x, Y=? Point prediction, prediction interval µ Y x3 =? Y x=? 50
51 Confidence interval of µ Y x at X=x Confidence interval : At X=x, the mean value of Y, Point estimation : Y = a+bx µ Y x 100(1- )% confidence interval : Y' ± t(n, α / ) sy x 1 n + (x x) (n 1)s x 51
52 Example. X= Y : Y = X Q : 60 95% Ans. 1. Point estimation : Y = (60)= % confidence interval : Y' = n = 10,(x x) Y' ± t 57.33, t (n, α / ) (8,0.05) s =.306,s = ( ) y x 1 n 57.33± (x x) + (n 1)s 1 10 y x + = 16.9, = 18.5,s x (8.94) x = 8.94 = 57.33±
53 Prediction interval of Y at X=x Prediction interval : If draw an individual from the population of X=x, Y=? Prediction : Y = a + bx 100(1- )% prediction interval : Y' ± t(n, α / ) sy x 1+ 1 n + (x x) (n 1)s x 異數 53
54 Example. X= Y : Y = X Q : 若 X=60 95% Ans. 1. Point estimation : Y = (60)= % confidence interval : Y' = 57.33, t =.306,s = 16.9, (8,0.05) y x n = 10,(x x) = ( ) = 18.5,s = 8.94 x 1 (x x) Y' ± t s 1+ + n (n 1)s (n, α /) y x x ± = 57.33± (8.94) 54
55 RECALL : ANOVA-table Recall an ANOVA-table in Chapter 1. SStotal = (Y Y) D.f. = n-1 for n observations. MStotal = SS total/(n-1) SST = due to treatment = (Yj Y) (Between-group variation) j:treatment Yj = estimated mean of Y of treatment-j group D.f. = k-1 for k treatments MST=SST/(k-1) Does treatment effect exist? SSE = due to random error = D.f. = n k MSE = SSE/(n-k) SS total = SST + SSE (Y Y j ) (Within-group variation) 55
56 ANOVA Table Source of Variation Sum of Squares Degrees of Freedom Mean Square Treatment SST k-1 SST/(k-1)=MST Error SSE n-k SSE/(n-k)=MSE Total SS total n-1 F MST/MSE F-test : H0 : No treatment effect exists Vs H1 : There are treatment effects. 56
57 In a regression model, SStotal = Total variation of Y : SStotal = Σ(Y Y) = (Y' Y) + (Y Y') = SSR + SSE SSR = The variation explained by the regression model SSE=The unexplained variation 57
58 SStotal= D.f. = n-1 for n observations. Mstotal = SS total/(n-1) In a regression model, ( Y Y) = (n 1)S SSR = due to regression model Y = estimated mean of Y at some X-level D.f. = -1=1 for regression coefficients MSR=SSR/1 = SSR Does the X-effect exist? Y = ( Y' Y) = (n Does the linearity exist? 1)b S X SSE = due to random error D.f. = n MSE = SSE/(n-) = S y x = ( Y Y') = (n )Sy x 58
59 ANOVA Table Source of Variation Sum of Squares Degrees of Freedom Mean Square Regression SSR -1 SSR/1=MSR Error SSE n- SSE/(n-)=MSE Total SS total n-1 F MSR/MSE F-test : The regression line is horizontal. vs. H0 : No global linear effect exists =0 H1 : There is a linear association. 59
60 (X) (Y) sum mean sd variance 60
61 度 SS total = SS reg = (Y Y) (Y' Y) = (n 1)S = (n 1)b SS error = SS total SS reg = Further, since for F-test, p-value = 0.0< 0.05, the linearity exists. Y S = X =
62 The Coefficient of Determination Coefficient of Determination : 數 the proportion of the total variation of Y that is explained by the variation of X. 數 Y 度 來 數 X 例 數 Y 度 數 X 例 6
63 The Coefficient of Determination Coefficient of determination : SSR r = SStotal exp lained by mod el = total total un exp lained = total (Y' Y) = (Y Y) SSE = 1 SStotal Coefficient of determination = (correlation coefficient) 63
64 數 數 度 r = = = 0.51 = S S y x y x SSR.5 (0.7) SStotal = MSE = SSE /(n ) = , = = 16.9 Note:adj(r ) = 1 MSE MStotal = / 9 =
65 EXCEL I. Correlation analysis Scatter plot XY Correlation : 數 若 兩 數 CORREL 數 若 兩 數 料 數 II. Linear regression : 料 65
66 Exercise. Correlation analysis : 37, 39, 43 Linear regression analysis : 45, 46, 53, 57 EXCEL: 47, 49 66
67 Bonus(%) : by EXCEL Exercise X= 數 ; Y= 金 數 (X) 金 (Y) 1. (correlation analysis) Scatter plot, correlation matrix X Y ( =0.05). 立 (regression analysis) 1.. (predicted equation) 說 數 數 ( =0.05) 3. ANOVA 論 67
(baking powder) 1 ( ) ( ) 1 10g g (two level design, D-optimal) 32 1/2 fraction Two Level Fractional Factorial Design D-Optimal D
 1 ( ) ( ) 1 10g g (two level design, D-optimal) 32 1/2 fraction Two Level Fractional Factorial Design D-Optimal D") ( ) 4 1 1 1 145 1 110 1 (baking powder) 1 ( ) ( ) 1 10g 1 1 2.5g 1 1 1 1 60 10 (two level design, D-optimal) 32 1/2 fraction Two Level Fractional Factorial Design D-Optimal Design 1. 60 120 2. 3. 40 10
( ) 4 1 1 1 145 1 110 1 (baking powder) 1 ( ) ( ) 1 10g 1 1 2.5g 1 1 1 1 60 10 (two level design, D-optimal) 32 1/2 fraction Two Level Fractional Factorial Design D-Optimal Design 1. 60 120 2. 3. 40 10
untitled
 Co-integration and VECM Yi-Nung Yang CYCU, Taiwan May, 2012 不 列 1 Learning objectives Integrated variables Co-integration Vector Error correction model (VECM) Engle-Granger 2-step co-integration test Johansen
Microsoft Word - p11.doc
 () 11-1 ()Classification Analysis( ) m() p.d.f prior (decision) (loss function) Bayes Risk for any decision d( ) posterior risk posterior risk Posterior prob. j (uniform prior) where Mahalanobis Distance(M-distance)
( ) t ( ) ( ) ( ) ( ) ( ) t-
 t ( ) ( ) ( ) ( ) ( ) t-") (Statistics). (Descriptive Statistics). (Inferential Statistics) (Inductive Statistics) ( ) t ( ) ( ) ( ) ( ) ( ) t- ( ) ( ) ( )? ( ) ( )? ( ) )?( t ) ( )? ( ) ( ) ( ) ( ) ( ) ( )? ( ) ( ) ( )? ( )?( t
(Statistics). (Descriptive Statistics). (Inferential Statistics) (Inductive Statistics) ( ) t ( ) ( ) ( ) ( ) ( ) t- ( ) ( ) ( )? ( ) ( )? ( ) )?( t ) ( )? ( ) ( ) ( ) ( ) ( ) ( )? ( ) ( ) ( )? ( )?( t
Untitled-3
 SEC.. Separable Equations In each of problems 1 through 8 solve the given differential equation : ü 1. y ' x y x y, y 0 fl y - x 0 fl y - x 0 fl y - x3 3 c, y 0 ü. y ' x ^ y 1 + x 3 x y 1 + x 3, y 0 fl
[9] R Ã : (1) x 0 R A(x 0 ) = 1; (2) α [0 1] Ã α = {x A(x) α} = [A α A α ]. A(x) Ã. R R. Ã 1 m x m α x m α > 0; α A(x) = 1 x m m x m +
![[9] R Ã : (1) x 0 R A(x 0 ) = 1; (2) α [0 1] Ã α = {x A(x) α} = [A α A α ]. A(x) Ã. R R. Ã 1 m x m α x m α > 0; α A(x) = 1 x m m x m +](/thumbs/91/107439066.jpg "[9] R Ã : (1) x 0 R A(x 0 ) = 1; (2) α [0 1] Ã α = {x A(x) α} = [A α A α ]. A(x) Ã. R R. Ã 1 m x m α x m α > 0; α A(x) = 1 x m m x m +") 2012 12 Chinese Journal of Applied Probability and Statistics Vol.28 No.6 Dec. 2012 ( 224002) Euclidean Lebesgue... :. : O212.2 O159. 1.. Zadeh [1 2]. Tanaa (1982) ; Diamond (1988) (FLS) FLS LS ; Savic
2012 12 Chinese Journal of Applied Probability and Statistics Vol.28 No.6 Dec. 2012 ( 224002) Euclidean Lebesgue... :. : O212.2 O159. 1.. Zadeh [1 2]. Tanaa (1982) ; Diamond (1988) (FLS) FLS LS ; Savic
spss.doc
 SPSS 8 8.1 K-Means Cluster [ 8-1] 1962 1988 8-1 2 5 31 3 7 20 F2-F3 2 3 F3-F4 3 4 109 8 8-1 2 3 2 3 F2-F3 F3-F4 1962 344 3333 29 9 9.69 1.91 1963 121 1497 27 19 12.37 1.34 1964 187 1813 32 18 9.70 1.06
STANDARD
 精 行 例 119 例 2004 年 2004 年 精 錄 1. 1 2. 1 3. 1 4. 1 5. 連 2 6. 2 7. 2 8. 2 9. 2 10. 2 11. 錄 3 律 12. 3 13. 律 3 14. 3 15. 3 16. 3 17. 數 3 18. 3 19. 4 20. 4 數 i 2004 年 精 六 21. 22. 4 23. 4 24. 4 25. 利 率 4 26.
)
") .. 1. 2. ) () () Pilot test () 1. 2. 3. 4. Scale (1). (nominal scale) 1. 2. 3. (1,2,3) (scale value) (arithmetic mean) (median) (mode) (chi-square test) (2). (ordinal scale) 5 1 A>B>C>D>E A B C D (non-parametric
.. 1. 2. ) () () Pilot test () 1. 2. 3. 4. Scale (1). (nominal scale) 1. 2. 3. (1,2,3) (scale value) (arithmetic mean) (median) (mode) (chi-square test) (2). (ordinal scale) 5 1 A>B>C>D>E A B C D (non-parametric
台灣經濟新報資料庫
 料 易 北 路 樓 02-8768-1088 [email protected] 錄 1 料 1 列 2 3 欄 5 5 六 6 TEJ Smart Wizard 易 9 列 9 料 9 1. 10 2. 11 3. 料 11 4. 12 5. Excel 12 參 TEJ Math Pal 易 13? 13 說 14 1-1TEJ 料 說 15 1-2 料 說 16 1-3 行 料 說 19
When the rejection rule for a test at every level α can be re-written as then xxx is the p-value of the test. xxx < α, If p-value < α, then the test c
 Hypothesis Testing - review The null hypothesis (H 0 ) and the alternative hypothesis (H 1 ) Type I error: rejecting H 0 when H 0 is true Type II error: failing to reject H 0 when H 1 is true (H 0 is false)
ENGG1410-F Tutorial 6
 Jianwen Zhao Department of Computer Science and Engineering The Chinese University of Hong Kong 1/16 Problem 1. Matrix Diagonalization Diagonalize the following matrix: A = [ ] 1 2 4 3 2/16 Solution The
11第十一章階層線性模式.DOC
 11.1 11.1.1 (student-level) (personal-level) ( ) (school-level) (organization-level) ( ) 1. (disaggregation) (estimated standard errors) (type one error). (aggregation) (within-group) (1997) (hierarchical
Microsoft Word - A200810-897.doc
 基 于 胜 任 特 征 模 型 的 结 构 化 面 试 信 度 和 效 度 验 证 张 玮 北 京 邮 电 大 学 经 济 管 理 学 院, 北 京 (100876) E-mail: [email protected] 摘 要 : 提 高 结 构 化 面 试 信 度 和 效 度 是 面 试 技 术 研 究 的 核 心 内 容 近 年 来 国 内 有 少 数 学 者 探 讨 过 基 于 胜 任 特 征
untitled
 說 參 例 邏 邏 1. 說 2. 數 數 3. 8 4. 理念 李 龍老 立 1. 理 料 2. 理 料 3. 數 料 4. 流 邏 念 5. 良 6. 讀 行 行 7. 行 例 來 邏 1. 說 說 識 量 2. 說 理 類 3. 數 數 念 4. 令 5. 良 6. 流 邏 念 7. 說 邏 理 力 1. 2. 3. 4. 5. 列 念 1 參 1. ( Visual Basic 例 ) (1)
Stochastic Processes (XI) Hanjun Zhang School of Mathematics and Computational Science, Xiangtan University 508 YiFu Lou talk 06/
 Hanjun Zhang School of Mathematics and Computational Science, Xiangtan University 508 YiFu Lou talk 06/") Stochastic Processes (XI) Hanjun Zhang School of Mathematics and Computational Science, Xiangtan University [email protected] 508 YiFu Lou talk 06/04/2010 - Page 1 Outline 508 YiFu Lou talk 06/04/2010
Stochastic Processes (XI) Hanjun Zhang School of Mathematics and Computational Science, Xiangtan University [email protected] 508 YiFu Lou talk 06/04/2010 - Page 1 Outline 508 YiFu Lou talk 06/04/2010
Microsoft PowerPoint - NCBA_Cattlemens_College_Darrh_B
 Introduction to Genetics Darrh Bullock University of Kentucky The Model Trait = Genetics + Environment Genetics Additive Predictable effects that get passed from generation to generation Non-Additive Primarily
untitled
 金 度 金 度 金 度 金 度 契 列 行 行 行 利 列 行 年 來 利 率 見 年 金 金 列 見 類 金 理 不 利 率 列 不 金 不 金 立 理 金 列 理 行 金 理 利 率 度 不 金 不 列 類 量 類 不 不 類 列 金 來 利 來 金 來 累 列 不 金 立 理 金 金 力 金 不 1/25 列 不 不 金 立 不 領 金 列 不 金 金 金 金 立 理 利 列 力 力 離 列
untitled
 館 館 0 年 9 館 90 0% 館館 Common School Graduates and Taiwanese Society during the Middle Period of the Japanese Occupation Peihsien Hsu * Abstract This paper attempts to reevaluate the social meaning of the
第一章
 中 華 大 學 碩 士 論 文 高 職 共 同 科 目 模 擬 考 成 績 與 入 學 測 驗 之 相 關 研 究 A Study of the Relationship between Both two-year and four year the Technological and Vocational Education joint college entrance examination and
热设计网
 例 例 Agenda Popular Simulation software in PC industry * CFD software -- Flotherm * Advantage of Flotherm Flotherm apply to Cooler design * How to build up the model * Optimal parameter in cooler design
國家圖書館典藏電子全文
 1 2 3 Umbilical cord Blood Analysis for Women at First Spontaneous Vaginal Delivery OBJECTIVE: To analyze the gas values of the umbilical cord blood in the first vaginal delivered babies and to verify
朝 陽 科 技 大 學
 金 Excel 老 老 A 9516130 9516133 96 年 1 1 錄 : 識.3 3 滑.4 料 類 6 料 7 數.8 六 列 9 10 類 10 立...16.17..18 料來...19 2 識 料 料 行 利 料 了 立 數理 料 Lotus 123 來 Windows 行 力 Microsoft Office 列 Excel Excel Microsoft Office 了 料
102_BS
 公 共 衛 生 核 心 課 程 基 本 能 力 測 驗 102 年 生 物 統 計 考 試 試 卷 一 選 擇 題 ( 答 案 4 選 1,1-20 題 每 題 3 分,21-30 題 每 題 4 分, 共 30 題 ) [ 以 下 1-4 題 為 題 組 ] 某 研 究 者 進 行 吸 菸 與 高 血 壓 的 關 聯 性 研 究, 他 以 隨 機 抽 樣 方 法, 發 現 50 位 有 高 血 壓
untitled
 100 年 度 年 理 年 理 970 蓮 路 880 http://www.tccn.edu.tw 038572158366 (99 年 1110100 年 度 年 理 ) // http://tad.tccn.edu.tw/front/bin/ptlist.phtml?category=47 1 100 年 度 年 理 列 年 立 列 力 度 力 度 立 立 年 異 行 歷 良 錄 不 行 錄
論 文 摘 要 本 文 乃 係 兩 岸 稅 務 爭 訟 制 度 之 研 究, 蓋 稅 務 爭 訟 在 行 訴 訟 中 一 直 占 有 相 當 高 的 比 例, 惟 其 勝 訴 率 一 直 偏 低, 民 87 年 10 月 28 日 行 訴 訟 法 經 幅 修 正 後, 審 級 部 分 由 一 級 一
 法 院 碩 士 在 職 專 班 碩 士 論 文 指 導 教 授 : 王 文 杰 博 士 兩 岸 稅 務 爭 訟 制 度 之 比 較 研 究 A comparative study on the system of cross-straits tax litigation 研 究 生 : 羅 希 寧 中 華 民 一 0 一 年 七 月 論 文 摘 要 本 文 乃 係 兩 岸 稅 務 爭 訟 制 度 之
<4D F736F F D20BDD7A4E5A4BAA4E5BB50A5D8BFFD2E646F63>
 附錄一最終模型 SIMPLIS 語法 Title: 建模樣本 Observed Variables: x1-x22 covariance matrix from file final01cov means from file final01means sample size: 2181 latent variables: interest instrument anxiety selfconcept
天 主 教 輔 仁 大 學 社 會 學 系 學 士 論 文 小 別 勝 新 婚? 久 別 要 離 婚? 影 響 遠 距 家 庭 婚 姻 感 情 因 素 之 探 討 Separate marital relations are getting better or getting worse? -Exp
 天 主 教 輔 仁 大 學 社 會 學 系 學 士 論 文 小 別 勝 新 婚? 久 別 要 離 婚? 影 響 遠 距 家 庭 婚 姻 感 情 因 素 之 探 討 Separate marital relations are getting better or getting worse? -Explore the impact of emotional factors couples do not
30 ml polystyrene 4 mm ph 0.1 mg blender M -cm D. pulex D. magna 20 L 2 20
 102 8 13 1020069337 102 10 15 NIEA B901.14B Daphnia 48 lethal concentration 50%, LC 50 acute toxic unit, TU a Daphnia pulex Daphnia magna 25 2 2 L 1 20 30 ml polystyrene 4 mm ph 0.1 mg blender 1. 1 2.
Microsoft Word doc
 中 考 英 语 科 考 试 标 准 及 试 卷 结 构 技 术 指 标 构 想 1 王 后 雄 童 祥 林 ( 华 中 师 范 大 学 考 试 研 究 院, 武 汉,430079, 湖 北 ) 提 要 : 本 文 从 结 构 模 式 内 容 要 素 能 力 要 素 题 型 要 素 难 度 要 素 分 数 要 素 时 限 要 素 等 方 面 细 致 分 析 了 中 考 英 语 科 试 卷 结 构 的
天 主 教 輔 仁 大 學 社 會 學 系 學 士 論 文 百 善 孝 為 先? 奉 養 父 母 與 接 受 子 女 奉 養 之 態 度 及 影 響 因 素 : 跨 時 趨 勢 分 析 Changes in attitude toward adult children's responsibilit
 天 主 教 輔 仁 大 學 社 會 學 系 學 士 論 文 指 導 老 師 : 翁 志 遠 百 善 孝 為 先? 奉 養 父 母 與 接 受 子 女 奉 養 之 態 度 及 影 響 因 素 : 跨 時 趨 勢 分 析 Changes in attitude toward adult children's responsibility to financially support and to live
untitled
 SPSS 1-1 1-2 SPSS 1-3 1-4 1-5 1-1 1. (independent variable) 2. (dependent variable) (response) 3. (case) 4. (population) 5. (sample) 6. (data) 7. (level) 8. (covariate) 9. (missing data) 2 SPSS 01 1-2
PowerPoint Presentation
 Decision analysis 量化決策分析方法專論 2011/5/26 1 Problem formulation- states of nature In the decision analysis, decision alternatives are referred to as chance events. The possible outcomes for a chance event
投影片 1
 Coherence ( ) Temporal Coherence Michelson Interferometer Spatial Coherence Young s Interference Spatiotemporal Coherence 參 料 [1] Eugene Hecht, Optics, Addison Wesley Co., New York 2001 [2] W. Lauterborn,
Microsoft Word - ch05note_1210.doc
 Section 5. Antiderivatives and indefinite integrals 反 導 函 數 與 不 定 積 分 上 一 章 我 們 已 經 學 過 微 分 以 及 它 的 應 用 現 在 我 們 考 慮 反 向 的 過 程, 稱 為 積 分 (antidifferentiation), 給 定 一 個 導 函 數, 找 出 它 原 始 的 函 數 積 分 也 有 許 多
ARCLE No.2
 The Relationship between Alphabetical Knowledge and Phonological Awareness among Elementary School Children Mitsue ALLEN-TAMAI Chiba University Abstract This study investigates the effect of teaching the
% % 34
 * 2000 2005 1% 1% 1% 1% * VZDA2010-15 33 2011. 3 2009 2009 2004 2008 1982 1990 2000 2005 1% 1 1 2005 1% 34 2000 2005 1% 35 2011. 3 2000 0. 95 20-30 209592 70982 33. 9% 2005 1% 258 20-30 372301 115483 31.
untitled
 論 年來 來 例 路 流 路 路 零 了 度 領 路 例 濾 螺 螺 金 降 了 論 良 量 不切 例 立 度 立 度 類 不 路 數 例 行 降 不 量 了 螺 金 ( W ) 1 了 不良 例 金 ( W P ) 來降 論 來 金 金 金 了 不良 金 流 不 流 不 率 流 金 流 金 兩 流 流 流 來 金 數 金 裡 流 論 利 參數來 論 螺 來 不良 串聯 數 串聯 流 金 ( W )
Microsoft PowerPoint _代工實例-1
 4302 動態光散射儀 (Dynamic Light Scattering) 代工實例與結果解析 生醫暨非破壞性分析團隊 2016.10 updated Which Size to Measure? Diameter Many techniques make the useful and convenient assumption that every particle is a sphere. The
 國 立 臺 中 教 育 大 學 教 育 學 系 課 程 與 教 學 碩 士 在 職 專 班 論 文 指 導 教 授 : 楊 銀 興 博 士 臺 中 市 國 小 教 師 兼 任 行 政 工 作 與 備 課 情 形 關 係 之 研 究 研 究 生 : 吳 婉 綺 撰 中 華 民 國 104 年 6 月 謝 辭 兩 年 來 的 進 修 即 將 畫 上 尾 聲, 一 步 步 走 到 這 裡, 實 在 是
untitled
 見 度 B 例 力 理 力 理 B 立 1992 年 2001 年 3 36 陸 料 兩 數 1947 行 理 行 B 力 度 練 度 練 練 理 力 練 練 練 B 練 錄 量 福利 度 金 金 行 金 ( ) 金 金 年 金 金 金 B 福利 勞 福利 ( 禮 旅 ) 福利 見 見 度 福利 1 說 更 ( 劉 2002) 料 都 若 留 裡 B 度 了 留 行 行 度 行 數 不 度 理 不
第五章 鄉鎮圖書館閱讀推廣活動之分析
 93 94 1 10 3 4 5-1 5-1 1 ( ) 94/1/10 1 94/1/10 2 94/3/4 4 () 94/3/4 94/3/4 94/3/4 94/3/5 94/3/5 3 94/3/4 94/3/4 94/3/4 1 94/1/26 2 94/1/26 94/1/26 94/1/26 2 94/1/26 94/1/26 1 94/2/22 1 94/2/22 2 94/2/22
東吳大學
 律 律 論 論 療 行 The Study on Medical Practice and Coercion 林 年 律 律 論 論 療 行 The Study on Medical Practice and Coercion 林 年 i 讀 臨 療 留 館 讀 臨 律 六 礪 讀 不 冷 療 臨 年 裡 歷 練 禮 更 老 林 了 更 臨 不 吝 麗 老 劉 老 論 諸 見 了 年 金 歷 了 年