i ii
|
|
|
- 搅晟 莫
- 9 years ago
- Views:
Transcription
1 二 零 一 四 年 年 報
2 i ii

3 释 义 及 重 大 风 险 提 示 A A i

4 ,979,051, ,140,120, ,570,060, ,140,120, ii

5 1 9,000
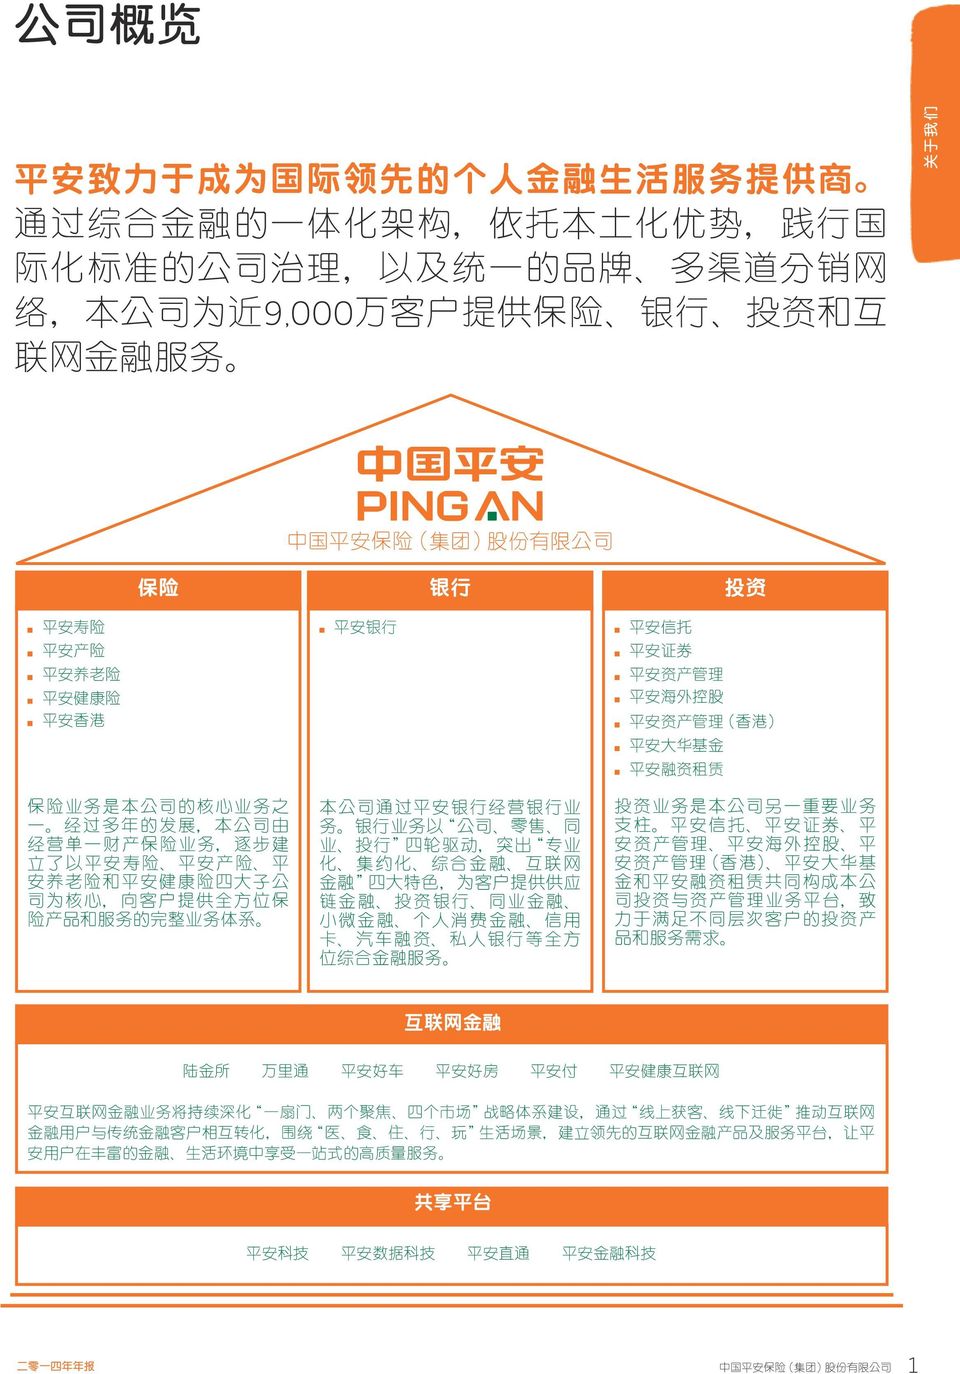
6 IPO A Millward Brown H

7 % 4 2,400 1, % % ,882 39, , , , ,631 17,311 19,475 20,050 28, ,564 4,005,911 2,285,424 2,844,266 3,360, , , , ,709 1,171, (1) (2) (1) (2)
 2010 2011 2012 2013 2014 4.93 0.75 (2) 0.65 3.56 0.55 2.30 2.50 2.53 0.40 0.")
8 (%) ,005,911 3,360, ,844,266 3,652,095 3,120, ,634, , , , , , ,617 8,892 7, , (%) , , ,372 62,341 46, ,375 62,353 46, ,338 47,930 36, ,750 39,279 28, ,050 39,215 28, , , ,916 (25.3) 280, (%) (%) (%) (%) (%) (25.7) (134) 22 (25) (55) (39) (49) (81) (289) (52) (27) (75) (22) 79 (4) (194) (48)
 18.3 16.4 (%) 18.2 16.5 1.9 13.8 1.7 13.8 21.38 28.79 (25.7) 35.")
9 , , ,874 1,474,098 1,230,367 1,074,188 (%) (%) (%) , , ,028 (%) (%) (%) ,527 32,926 32,540 (%) (1) , , ,460 (%) ,610 91,280 79,116 (%) (%) (%) ,154 58,391 48,388 43,629 35,192 29,802 65,132 57,737 47,972 (%) (2) (%) (3) (%) (4) 53,046 40,688 33,036 19,802 15,231 13,512 (%) (%) (%) ,533,183 1,217,002 1,021,108 1,024, , ,780 (%) (5) (%) (%) (6) 5,186 4,141 3,539 2,199 1,962 1, , , ,025 3,826 2,639 2, (1) = ++ (2) = (3) = (4) (5) (6) 5
 2.57 2.31 2.37 (%) 36.33 40.77 39.41 1,533,183 1,217,002 1,021,108 1,024,734 847,289 720,780 (%) (5) 10.86 9.90 11.37 (%) 1.02 0.89 0.95 (%) 200.90 201.06 182.")
10 % 24% APP e H % , % % , % 20.9% 2, % % 1, % % 6, % 1, % 95.3% , % 34.3% % 6

11 , % % % % , % % % 27.7% % %3, % 70.0% % P2P

12 , ,036 C2B % , % 39.5% 27.2% , ,058 1, , ,

13

14 10
15 % % 13.8% % % (%)
 150 100 50 0-50 08-12")
16 2014 (Fortune) (Forbes) (Financial Times) (Euromoney) (FinanceAsia) 29 7 & 500 & (Institutional Investor) (Corporate Governance Asia) (FinanceAsia) 7 (The Asset) 3A (Asiamoney) 12
 (FinanceAsia) 7 (The Asset) 3A")
17 & (Millward Brown, WPP) BrandZ BrandZ Interbrand &

18 % , , % % , % % , , , ,051 (400,541) (316,292) 62,341 46,339 47,930 36,014 39,279 28, ,689 12,219 8,807 5,856 19,147 14,904 (1) 2,199 1, (2) 1, ,930 36,014 (1) (2) 14

19 ,555 12, % (7,132) (2,105) 14,423 10, % (%) 4,005,911 3,360, ,652,095 3,120, , , H ,279 28, (%) 2,236 1, ,841 27, ,215 30, , ,080 (33.9) 14,983 8, ,886 26, , , , , ,901 10, ,119 25,482 (40.7) 14,344 10, ,452 16, ,725 3, ,013 12, ,623 8, ,068 17, ,635 23, ,119 56, ,984 7,
 14,344 10,043 42.8 24,452 16,058 52.3 4,725 3,495 35.2 17,013 12,060 41.")
20 (%) 22,413 13, ,735 54, (191) (381) (49.9) 17,636 11, ,188 7, ,532 9, ,937 25, ,915 11, ,974 3, ,104 17, ,896 8, ,423 10, ,774 (6,212) , ,526 3,402 (384) 4, ,806 37,816 (8,934) 347,371 39,603 47, , ,816 (8,934) 450,147 3, ,747 2, ,770 39,603 47,250 46, ,767 16
 2014 1 1 2014 12 31 33,655 327 55,526 3,402 (384) 4,311 230,806 37,816 (8,934) 347,371 39,603 47,250")
21 2, ,400 2, (1) 241, ,125 11,134 8, , ,358 (2) 173, ,091 8,861 6, , ,377 (1) (2) [2009] , , , ,091 (%) (1) (1) % 17
22 ,108 57,846 1, ,235 58, , ,965 3,913 3,475 68,455 64, ,244 5, (%) % APPATM APP 63.53, , % 1, % 6, , % % 1, % 95% ,171 95% % 18
23 (2) (2) (2) (1) 19,515 9,942 2,597 9,338 3,066 6,173 5,887 (1) (2) % , , % , , % 19
24 , ,358 (4,784) (4,352) (64,673) (61,629) 183, , , ,919 62,319 46, (78) (49) (146) 7,972 6, , ,131 (1) (149,837) (131,605) (22,797) (15,798) (1,150) (602) (22,856) (19,325) (1,511) (1,055) (24,667) (17,822) (8,841) (1,259) (230,693) (186,589) (3,590) (2,361) 15,689 12,219 (1) % ,372 41,540 43,469 33, ,231 2,138 3,192 2,929 53,308 44,156 46,829 36, , , ,755 97, , , , ,341 1,525 2,343 1,516 2,335 6,858 4,316 6,922 4, ,386 6,661 8,442 6,711 5,465 4,529 5,395 4,465 13,851 11,190 13,837 11, ,102 3, ,260 7,285 9,220 7,255 13,439 11,046 9,829 7, ,515 11,128 9,852 7, , , , , , % 20142, % , % 20141,
25 % ,489 21,143 10,743 6, % % ,884 10,503 7,249 2,942 3,781 2,707 1, , ,293 76,166 71,314 22,108 10,823 20,030 14,609 13,734 10,223 2,532 1,479 2,407 2, , ,358 53,308 44,156 (%) (47.9) 20.2 (15.4) 18.5 (23.8) 13.6 (6.6) 7.1 (6.1) 2.1 (0.1) 0.1 (0.1) (%) (49.4) 30.1 (32.5) 8.8 (4.9) 7.9 (6.6) 5.4 (4.7) 1.0 (0.7) 1.0 (1.2) ,041 33,458 17,649 16,870 16,964 13,817 15,643 13,931 14,784 14, ,081 92, , ,358 21
26 (%) ,188 7, (15.3) 7.0 (7.7) 6.7 (6.3) 6.2 (6.4) 5.8 (6.4) 58.5 (57.9) 6,036 4,720 5,587 5,292 17,405 15,910 8,499 7,004 (3,459) (2,511) 5,871 5, (1) 58,346 46,488 (2) 5, (8,822) (1,253) 55,045 45,967 (%) (3) (%) (3) (1) (2) (3) Modified Dietz % % % ,710 88, , , % % % % % % % 5.0% ,442 2,927 2,262 1,190 15,093 11,681 22,797 15,798 22
27 % % % % % ,970 2,596 2,657 2, , ,483 69,452 65, , ,083 52,316 65, , , , , ,351 2,427 2,308 90,721 76, , , , % , , , ,365 (%) (1) (1) , % 23
28 % % 18.9% % % ,787 25,982 1,782 1,747 33,569 27,729 7,589 7,305 (1) 49,616 37,573 (1) (%) , % 19,849, ,530 55,559 1,344 77,912 36,404 15,299 1,987 2,765 18,214 9,851,085 5,091 2,770 (105) 4,959 8,171,643 3,163 1, , ,399,853 2, ,912 24
29 (%) , , ,610 91,280 6,740 5,476 2 (1) (4) (36) ,042 97,334 (1) (63,172) (55,152) (2) (15,450) (11,486) (8,050) (6,486) (24,692) (21,202) 6,997 5,707 (238) (397) (292) (240) (201) (121) (105,098) (89,377) 36 (31) (3,173) (2,070) 8,807 5,856 (1) (2) 77.3 (77.9) 20.4 (19.8) 2.3 (2.3) % 20141, % % % % % % ,667 90,091 29,257 22,850 3,226 2, , , ,607 17,729 10,714 8,741 8,800 7,008 8,500 6,993 8,363 6,988 58,984 47, , ,674 25
30 (%) (15.3) 7.5 (7.6) 6.1 (6.1) 5.9 (6.0) 5.8 (6.0) 58.9 (59.0) (1) 6,569 5,571 (2) (5) 6,948 5,671 (%) (3) (%) (3) (1) (2) (3) Modified Dietz % % % % % ,179 47,169 6,762 6,909 1,231 1,074 63,172 55, % % % ,673 7,856 4,180 3, ,450 11,486 (%) % % % %
31 % ,154 58,391 43,629 35, ,783 93,583 78,096 63,125 35,010 28,334 2,677 2, ,783 93, (1) 66,652 53,067 (2) 5, (8,828) (1,253) 63,729 52,652 (%) (3) (%) (3) (1) (2) (3) Modified Dietz % , % % % A 52.9% %5.1% % % 10.5% 14.1% 27
32 (%) (%) 235, , , , , , (1) 80, , (2) 49, , , , , , (1) 16, (3) 8, , , , , , ,474, ,230, , , , , , , , , , , ,474, ,230, (1) (2) (3) 28
33 (%) (82.2) 14.1 (10.5) 4.8 (5.6) 1.4 (1.7) 67% 29% AAA94% AA+ 5% AA1% ,231 70,256 30,243 24,714 48,771 40,865 18,385 14,793 >=100% 219.9% 171.9% 164.5% 167.1% %
34 , % % , % 10, % % % % % 30
35 e e e E 1, % % % ,046 40,688 17,378 10,456 3,168 1,140 (10) (82) (388) (163) ,407 52,189 (5,482) (4,065) (26,668) (21,279) (15,011) (6,890) (47,161) (32,234) % 8.64% 8.64% (52) 85 (6,392) (4,809) 19,802 15, % 31
36 ,885 3,315 20,422 19,188 71,270 53,528 23,179 16, ,202 93,102 (37) (32) (26,911) (24,457) (37,551) (27,253) (1,657) (672) (66,156) (52,414) 53,046 40,688 (%) (1) (%) (2) ,064,595 1,762,388 1,963,857 1,668,199 (1) (2) % ,544 1,220 2, ,780 4,996 1,967 1,467 3,730 1, ,535 1,233 19,706 11,821 (543) (223) (1,639) (1,044) (146) (98) (2,328) (1,365) 17,378 10, % ,668 21,279 (%) (1) (1) % %
37 (%) (%) (1) (1) ,280,430 1,005, , ,665 1,533,183 1,217,002 (%) (61.6) 27.5 (28.2) 10.1 (10.2) , %22.6% 6, % %18.1% 2, % % 18.5% 1, % % 83.5 (82.6) 16.5 (17.4) , ,721 36,949 18,027 4,374 4, , % , , , , , ,899 86,834 1,024, ,289 2,146 1,575 3,981 1,591 1,024, ,289 10,501 7,541 (%) (21,097) (15,162) (%) (%) % % %
38 (%) (%) 312, , , , , , , , , , ,024, , % 8.64%8.64% , , , , , ,884 1,380,432 1,170,412 (%) >=7.5% (%) >=8.5% (%) >=10.5% (1) 34
39 % % % , % 500 1, % , , % 1, % % 1, % ,147 78, , ,766 48,757 25, ,552 71, , ,364 35
40 (%) (28.4) 27.2 (36.5) 13.2 (9.2) 32.4 (25.9) % ,664 39,696 27,863 25,947 73,721 37, , ,375 71,642 58,212 32,152 53,829 56,086 41, ,997 16, ,724 17, , , , ,320 (1) (2) 13,979,910 10,907, , , % 75.1% 30.0% 34.5% 30.7% 24.9% 70.0% 65.5% , , %70.0% 1, %49.3% , % 35.3% % 60% 50%
41 II %100% 74.2% >=200 14,587 12,937 >=100% 170.6% 202.1% >=40% 74.2% 75.5% 2014 APP 2014 E
42 ,854 2,117 1,682 1, ,186 4,141 (277) (200) (1,195) (1,003) (648) (225) (93) (250) (218) (34) (2,431) (1,712) 2 10 (558) (477) 2,199 1, % ,123 2, ,294 2,944 (1,440) (827) (1,440) (827) % % (1) (2) (94) (250) 1,661 1,189 (1) (2) % % ,854 2,117 38
43 % 298.8% % % % 38.9% % 1, % % ,002 1,485 1,721 1, (52) ,826 2,639 (195) (142) (1,908) (1,533) (483) (4) (11) (40) (45) (2,630) (1,731) (32) (260) (240) (138) % , ,214 1,642 (175) (115) (37) (42) (212) (157) 2,002 1,485 39
44 % % (1) 1,703 1,117 (2) 103 (3) (23) (38) 1,783 1,076 (1) , % 1, % % % (2) % % ,363 1,275,288 1,631, % 35.6% 12.8%
45
46 1.377,000 APP 2,000 P2P ,925 9,141 3, % 2, APP 1,971 1,401 APP1, P2P 42
47 APP 13,734 1,971 9,141 6,925 2,767 1,016 1, APP ,315 3, ,571 1,366 2, , ,971 6,343 1, , , , ,394 1, ,426 (1) (2) APP 43
48 % 19P2P 5 P2PLend Academy P2P % %27.6% , O2O ,000 C2BB2B B2C 2014 O2O ,0005, APP APP ,200-10% x24
49 ,935 10%2014 1, ,903 6,799 (1) 1,951 1,913 (2) ,347 1, (3) 8,935 7,903 (1) (2) (3) % ,510 1, , , , ,544 1,497 1, ,019 45
50 (%) 2013 (%) 20, , , , , , , , APP
51 IT IT APP E ,600 MIT 1,300MIT 99% MIT40% MIT 89.4% E % 2014 APP % 95% 0.82
52 ,
53 % 11.0% 284, ,371 89,829 62, (7,342) (8,242) , ,219 (33,890) (27,695) 458, , , , % 11.0% 25,190 20,563 (3,224) (2,400) 21,966 18,163 49
54 % % %0.25%5.5% 3 25%12% 3%18%5.5% 4 ( )65% 65% ( ) 60% 50% 5 15% 85% 6 7 2% 8 75% 80% 50
55 (%) (%) 46,731 38, ,800 16, ,090 13, ,382 6, (35.0) 72,203 59, ,966 18, % 43.6% 44.7% 43.5% 5.0% 6.1% 8.9% 11.0% 3.6% 7.0% 13.7% 16.8% 30.4% 30.8% 37.6% 37.0% 100% 10% , ,038 19, , % 2, , , % 51
56 2014 1, (5,987) , ,615 21,888 3, ,304 (1,265) , ,839 H A (1,000) 10 (5,541) , , ,724 43,899 (20,974) 1, (5,987) ,477 52
57 % 10% 10% 5% 150% 10.5% 11.0% 11.5% 11.0% 182, , , , % 11.0% 11.5% 11.0% 23,585 21,966 20,464 22, ,394 21, ,050 21, ,177 24, ,239 19,812 10% 178,181 22,692 10% 178,081 22,950 10% 176,381 22,214 5% 167,898 21, % 157,275 20, % 11.0% 53
58 H 594,056, A A 381,971, ,255 5,500 21,000 5,150 15,000 3, ,791 34, H , % AHA (%)
59 (IAIS) (FSB) (G-SIIs) IAIS (LRMP) 20132, % 20141, H , ,786 66, ,058 4,668 3, , , % % , ,916 (236,889) (236,063) 85,368 6, , , , ,452 >=100% 205.1% 174.4% H
60 (FSB) (IAIS) (G-SIIs) G-SII G-SII 2014FSB IAISG-SII (SRMP)(RRP) (LRMP) G-SII G-SII G-SII 56
61 2014 G-SII 57
62 (1,247) 10 3,009 * +10% -10% 8, % 4,712 +5% 1,683 * 10% 10% % 1,831 +5%
63 , (VaR) (VaR) (99%) 10 59
64 (VaR) ,705 5% % 1,020 1,950 60
65 AA A % A 99.92% % KPI
66 CEO ,400 (NPS) NPS2 95% % 1 1,091 SAAS 62
67 63 EAP , APP 24 1, EAP 26,950 5,058 1, ,
68 A
69 , % 10, , , %
70 A (%) (%) 1 4,786,409, ,971,800 (1) 5,168,381, ,129,732, ,056,000 3,723,788, ,916,142, ,056, ,971,800 (1) +976,027,800 8,892,169, ,916,142, ,056, ,971,800 (1) +976,027,800 8,892,169, (1) 381,971,800 A 2013A H ,056, ,056,000 A ,000, ,000, ,056,000HH H 3,129,732,4563,723,788, A A 381,971,800 A A A AA381,971,800H594,056, ,892,169,892A5,168,381,436H3,723,788, , , , ,665 66
71 (%) ,359,551 A 190,030, ,500,996 H 394,500, ,886, ,797,118 H 252,886, ,929,005-21,634,118 H 38,985, ,864,004-37,801,061 A ,112,886-41,000,000 A 98,000,000 TEMASEK FULLERTON ,259, ,169,541 A ALPHA PTE LTD ,355, ,877,642 A 85,000, ,581, ,124,571 A ,518,830-29,500,183 A 43,500, % 10% H 872,316, % A 98,112, %10.91% 10% 100% 89.81% 4.44% 2.53% 2.84% 1.10% 32.07% 57.02% 67
72 % ,616,500, Silom Road, C.P. Tower, Bangrak, Bangkok 10500, Thailand A A A ,000, A 25,816,258, A ,690 A A A A (%) (1) ,166, ,070, ,228, ,344, ,344, ,804, ,804, ,674, ,674, ,000, ,000, ,305, ,305, ,154, ,771, ,258, A 10,255,013,000 A A 68
73 A A A 381,971,800 A A A A 26,000,000,000 15,744,987, ,971, ,971, % 10,255,013, % A A H A ASD A AAA AAA A A0.8% A A %A
74 ,965,569,000 A A 629,922,613 A7,916,142, %A34,431, %9,140,120, (113005) (191005) H XV % H/A H/A H/A (%) (%) H 1,174,978, ,000, (1),(2),(3) 1,224,978, (1) 302,662, Dhanin Chearavanont H 317 1,174,978, ,000, (1),(2),(3) 1,224,978, (3) 302,662, King Ace International Limited H 317 1,174,978, ,000, (1),(2),(3) 1,224,978, (3) 302,662,
75 H/A H/A H/A (%) (%) H (1), (2) 394,500, H (1), (2) 302,662, ,662, H (1), (2) 224,929, H (1), (2) 252,886, JPMorgan Chase & Co. H 110,978, ,952, , ,659, (4) 271,591, (4) 66,340, UBS AG H 251,534, ,401, (5) 50,250, (5) 322,185, (5) 548,202, UBS Group AG H 20,401, (6) 301,784, (6) 322,185, (6) 548,202, BlackRock,Inc. H (7) 201,400, A 481,359, (1) 394,500,996 H302,662,295 H224,929,005 H252,886,317 H 302,662,295 H 31750,000,000 H (2) Chia Tai Primrose Investment LimitedChia Tai Primrose Investment Limited Chia Tai Primrose Holdings Limited Chia Tai Primrose Holdings Limited Chia Tai Giant Far LimitedChia Tai Giant Far LimitedChia Tai Resources Holdings Limited Chia Tai Resources Holdings Limited CPG Overseas Company Limited CPG Overseas Company Limited (3) Boom Dragon Limited Long Growth Global Limited 25,000,000 HBoom Dragon Limited Long Growth Global Limited King Ace International LimitedKing Ace International Limited Dhanin ChearavanontKing Ace International Limited Dhanin Chearavanont3171,174,978,613 H (4) JPMorgan Chase & Co.271,591,613 H 66,340,177 H JPMorgan Chase & Co HJPMorgan Chase & Co. 71
76 % J.P. Morgan Clearing Corp J.P. Morgan Securities LLC ,049,567 0 JF International Management Inc. JPMorgan Asset Management (Asia) Inc ,912,500 0 JF Asset Management Limited JPMorgan Asset Management (Asia) Inc ,777,000 0 JPMorgan Asset Management (Japan) Limited JPMorgan Asset Management (Asia) Inc ,000 0 JPMorgan Asset Management (Taiwan) Limited JPMorgan Asset Management (Asia) Inc ,179,500 0 J.P. Morgan Investment Management Inc. JPMorgan Asset Management Holdings Inc ,485,160 0 J.P. Morgan Whitefriars Inc. J.P. Morgan Overseas Capital Corporation ,816,976 37,821,020 J.P. Morgan Securities plc J.P. Morgan Capital Financing Limited ,112,216 28,516,957 Bank One International Holdings Corporation J.P. Morgan International Inc ,929,192 66,340,177 J.P. Morgan International Inc. JPMorgan Chase Bank, N.A ,929,192 66,340,177 J.P. Morgan Chase International Holdings J.P. Morgan Chase (UK) Holdings Limited ,112,216 28,516,957 J.P. Morgan Securities plc J.P. Morgan Chase International Holdings ,112,216 28,516,957 JPMorgan Chase Bank, N.A. JPMorgan Chase & Co ,598,012 0 JPMorgan Asset Management (UK) Limited JPMorgan Asset Management Holdings (UK) Limited ,837,000 0 JPMorgan Funds Management, Inc. JPMorgan Distribution Services, Inc ,182 0 JPMorgan Asset Management (Singapore) Limited JPMorgan Asset Management (Asia) Inc ,500 0 J.P. Morgan Structured Products B.V. J.P. Morgan International Finance Limited ,200 J.P. Morgan Capital Financing Limited JPMorgan Chase & Co ,112,216 28,516,957 J.P. Morgan Securities LLC J.P. Morgan Broker-Dealer Holdings Inc ,049,567 0 J.P. Morgan Broker-Dealer Holdings Inc JPMorgan Chase & Co ,049,
77 % J.P. Morgan Capital Holdings Limited J.P. Morgan International Finance Limited ,112,216 28,516,957 JPMorgan Asset Management Holdings Inc JPMorgan Chase & Co ,862,660 0 JPMorgan Asset Management (Asia) Inc. JPMorgan Asset Management Holdings Inc ,540,500 0 J.P. Morgan Chase (UK) Holdings Limited J.P. Morgan Capital Holdings Limited ,112,216 28,516,957 JPMorgan Asset Management Holdings (UK) Limited JPMorgan Asset Management International Limited ,837,000 0 J.P. Morgan Overseas Capital Corporation J.P. Morgan International Finance Limited ,816,976 37,821,020 JPMorgan Asset Management International Limited JPMorgan Asset Management Holdings Inc ,837,000 0 JPMorgan Chase Bank, N.A. JPMorgan Chase & Co ,929,192 66,340,177 J.P. Morgan International Finance Limited Bank One International Holdings Corporation ,929,192 66,340,177 JPMorgan Distribution Services, Inc. JPMorgan Chase & Co ,182 0 JPMorgan Chase & Co. 103,659,234 H 44,683,422 H 49,407,177 H 11,408,460 H9,220,500 H 5,329,500 H15,982,500 H 8,254,843 H5,572,389 H 19,690,619 H18,631,788 H (5) UBS AG50,250,169 H UBS AG HUBS AG % UBS Fund Management (Switzerland) AG UBS AG ,715,500 0 UBS Fund Services (Luxembourg) S.A. UBS AG ,209,483 0 UBS Global Asset Management (Americas) Inc. UBS AG ,703,500 0 UBS Global Asset Management (Australia) Ltd UBS AG ,500 0 UBS Global Asset Management (Canada) Inc. UBS AG ,378,
78 % UBS Global Asset Management (Hong Kong) Limited UBS AG ,992,468 0 UBS Global Asset Management (Japan) Ltd UBS AG ,214,552 0 UBS Global Asset Management (Singapore) Ltd UBS AG ,532,500 0 UBS Global Asset Management Trust Company UBS AG ,000 0 UBS Global Asset Management (UK) Ltd UBS AG ,175,000 0 UBS Global Asset Management (Deutschland) GmbH UBS AG ,500 0 UBS Financial Services Inc. UBS AG ,466 0 UBS Bank (Canada) UBS AG ,000 0 UBS Swiss Financial Advisers AG UBS AG ,500 0 UBS Limited UBS AG , ,729,094 H548,202,657 H 1,070,700 H3,536,000 H 650,550 H11,140,471 H 13,223,238 H24,180,124 H 172,784,606 H509,346,062 H (6) UBS Group AG301,784,858 H 548,202,657 H UBS Group AG HUBS Group AG % UBS AG UBS Group AG ,534, ,202,657 UBS Fund Services (Luxembourg) S.A. UBS Group AG ,209,483 0 UBS Global Asset Management (Americas) Inc. UBS Group AG ,703,500 0 UBS Global Asset Management (Australia) Ltd UBS Group AG ,500 0 UBS Global Asset Management (Canada) Inc. UBS Group AG ,378,
79 % UBS Global Asset Management (Hong Kong) Limited UBS Group AG ,992,468 0 UBS Global Asset Management (Japan) Ltd UBS Group AG ,214,552 0 UBS Global Asset Management (Singapore) Ltd UBS Group AG ,532,500 0 UBS Global Asset Management Trust Company UBS Group AG ,000 0 UBS Global Asset Management (UK) Ltd UBS Group AG ,175,000 0 UBS Global Asset Management (Deutschland) GmbH UBS Group AG ,500 0 UBS Financial Services Inc. UBS Group AG ,466 0 UBS Bank (Canada) UBS Group AG ,000 0 UBS Swiss Financial Advisers AG UBS Group AG ,500 0 UBS Fund Management (Switzerland) AG UBS Group AG ,715,500 0 UBS Limited UBS Group AG , ,729,094 H548,202,657 H 1,070,700 H3,536,000 H 650,550 H11,140,471 H 13,223,238 H24,180,124 H 172,784,606 H509,346,062 H (7) BlackRock,Inc.201,400,656 H BlackRock,Inc HBlackRock,Inc. % Trident Merger, LLC Blackrock Inc ,326,000 BlackRock Investment Management, LLC Trident Merger, LLC ,326,000 BlackRock Holdco 2 Inc. Blackrock Inc ,074,656 BlackRock Financial Management, Inc. BlackRock Holdco 2 Inc ,101,156 BlackRock Financial Management, Inc. BlackRock Holdco 2 Inc ,973,500 BlackRock Holdco 4 LLC BlackRock Financial Management, Inc ,548,500 75
80 % BlackRock Holdco 6 LLC BlackRock Holdco 4 LLC ,548,500 BlackRock Delaware Holdings, Inc. BlackRock Holdco 6 LLC ,548,500 BlackRock Institutional Trust Company, N.A. BlackRock Delaware Holdings, Inc ,659,500 BlackRock Fund Advisors BlackRock Delaware Holdings, Inc ,889,000 BlackRock Advisors Holdings Inc. BlackRock Financial Management, Inc ,552,656 BlackRock Capital Holdings, Inc. BlackRock Advisors Holdings Inc ,000 BlackRock Advisors, LLC BlackRock Capital Holdings, Inc ,000 BlackRock International Holdings Inc. BlackRock Advisors Holdings Inc ,559,656 BR Jersey International LP BlackRock International Holdings Inc ,559,656 BlackRock Cayco Ltd. BR Jersey International LP ,492,500 BlackRock Trident Holding Company Limited BlackRock Cayco Ltd ,492,500 BlackRock Japan Holdings GK BlackRock Trident Holding Company Limited ,492,500 BlackRock Japan Co Ltd BlackRock Japan Holdings GK ,492,500 BlackRock (Institutional) Canada Ltd BR Jersey International LP ,000 BlackRock Holdings Canada Limited BlackRock (Institutional) Canada Ltd ,000 BlackRock Asset Management Canada Limited BlackRock Holdings Canada Limited ,000 BlackRock Australia Holdco Pty Ltd BR Jersey International LP ,165,000 BlackRock Investment Management (Australia) Limited BlackRock Australia Holdco Pty Ltd ,165,000 BlackRock HK Holdco Limited BR Jersey International LP ,236,527 BlackRock Asset Management North Asia Limited BlackRock HK Holdco Limited ,236,527 BlackRock Group Limited BR Jersey International LP ,328,629 BlackRock (Netherlands) B.V. BlackRock Group Limited ,500 Blackrock Advisors (UK) Limited BlackRock Group Limited ,879,375 BlackRock International Limited BlackRock Group Limited ,000 BlackRock International Limited BlackRock Group Limited ,526,186 BlackRock Luxembourg Holdco S.a.r.l. BlackRock Group Limited ,666,480 BlackRock Investment Management Ireland Holdings Ltd BlackRock Luxembourg Holdco S.a.r.l ,449,583 BlackRock Asset Management Ireland Limited BlackRock Investment Management Ireland Holdings Ltd ,449,583 BlackRock (Luxembourg) S.A. BlackRock Luxembourg Holdco S.a.r.l ,216,897 BlackRock Investment Management (UK) Ltd BlackRock Group Limited ,476,500 76
81 % BlackRock Investment Management (UK) Ltd BlackRock Group Limited ,132,588 BlackRock Holdings Deutschland GmbH BlackRock Investment Management (UK) Ltd ,000 BlackRock Asset Management Deutschland AG BlackRock Holdings Deutschland GmbH ,000 BlackRock Fund Managers Ltd BlackRock Investment Management (UK) Ltd ,288,500 BlackRock Life Limited BlackRock International Limited , ,000 H (8) XV
82 (1)
83 (Stephen Thomas MELDRUM) (1)
84 (2) 樑 (1) (2) CEO
85 (FSA)
86 True Corporation Public Company Limited CP ALL Public Company LimitedTrue Visions Public Company Limited
87 (Stephen Thomas MELDRUM) Lincoln National (UK) plc ILI(UK) Cannon Assurance Cannon Lincoln Lincoln National (UK) DSG International (Thailand) PLC (CFP)(CFMP) JPMorgan Chinese Investment Trust plc ARN Investment SICAV ARN Asian Enterprise Fund Limited AMP(151)
88
89 (FCIS) (FCS) CEO BNP PARIBAS
90 ARN Investment SICAV JPMorgan Chinese Investment Trust plc
91 XV XV XV H/A H A(%) (%) H 10,000 10, A 1,898,280 1,898, A 100, , H 12,000 12, H 12,000 12, A 6,600 6, (1) A 73,019,013 43,518,830-29,500, A 1,700 1, 樑 H 10,000 10, (1) H/A (%) A 43,542 52,251 +8,709 (1) (1) ,520,745,
92 , ,
93 (Stephen Thomas MELDRUM) 樑
94
95 ,999 68, % 123, % 13, % 30, % 11, % 111, % 86, % 26, % (%) (%) APP ,03960, % 166 1,
96 H ( 92
97 (3) /1 100% /1 100% /1 100% /1 100% /1 100% (1) (1) /1 0% /1 0% /1 0% /1 0% /1 100% /1 100% /1 0% /1 100% /1 0% /1 100% (Stephen Thomas Meldrum) /1 100% /1 100% /1 100% /1 0% (1) (2) 93
98
99 5 5/5 100% 0/5 0% 5/5 100% 0/5 0% 5/5 100% 0/5 0% 5/5 100% 0/5 0% 5/5 100% 0/5 0% (1) 3/3 100% 0/3 0% (1) 1/2 50% 1/2 50% 4/5 80% 1/5 20% 4/5 80% 1/5 20% 2/5 40% 3/5 60% 3/5 60% 2/5 40% 4/5 80% 1/5 20% 5/5 100% 0/5 0% 5/5 100% 0/5 0% 5/5 100% 0/5 0% 3/5 60% 2/5 40% (Stephen Thomas Meldrum) 5/5 100% 0/5 0% 5/5 100% 0/5 0% 5/5 100% 0/5 0% 5/5 100% 0/5 0% (1) 95
100 H ,916,148, ,562,266, ,916,205, ,979,051,
101 % H H 2/2 100% 0/2 0% 2/2 100% 0/2 0% 2/2 100% 0/2 0% 2/2 100% 0/2 0% 2/2 100% 0/2 0% % 97
102 /5 100% 0/5 0% 5/5 100% 0/5 0% (Stephen Thomas Meldrum) 5/5 100% 0/5 0% 5/5 100% 0/5 0% 5/5 100% 0/5 0% 3/5 60% 2/5 40%
103 % /3 100% 0/3 0% 3/3 100% 0/3 0% 2/3 67% 1/3 33% 2/3 67% 1/3 33% 2/3 67% 1/3 33% % 1 99
104 /1 100% 0/1 0% 1/1 100% 0/1 0% 1/1 100% 0/1 0% 1/1 100% 0/1 0% 1/1 100% 0/1 0%
105 ( ([email protected]) ([email protected]) HA e , A 101
106 (Stephen Thomas Meldrum)
107
108 TeamMate
109 D A.2.1 A
110 % 5% ,916,148, ,562,266, A H
111 ,916,205, ,979,051, A H % ,979,051, ,140,120, ,570,060, ,140,120,
112 (1) (%) 2013 (2) ,145 28, (2) ,562 20, (2) ,166 19, (1) (2) , ,056,000H 36,831,472,000 36,480,684,
113
114
115 %
116 < 2013 ><2013> < 2014 > <2014 > < 2014 > / / /4 100% 0/4 0% /4 100% 0/4 0% /4 50% 2/4 50% /4 100% 0/4 0% /4 100% 0/4 0% /4 100% 0/4 0% /4 100% 0/4 0%
117 (1) (2) 2014 (3) ,056,000H 36,831,472,000 36,480,684, (4) (5) (6)
118 (%) (13) A (2) (1) (2) (3) (%) 1 HK ,288 22,474 1,258 5,869 2 HK ,774 18, ,239 3 HK ,534 17, ,676 4 HK ,586 6, , ,407 6, (472) 114
119 (%) 6 BE Ageas 23,874 2, (491) Fortis ,167 1, ,160 1, HK , HK (1) (2) (3) (%) , (1) (1) 13, ,944 11,913 7,
120 %-50% 50%-60% H H 2013 H H 20% H ,056,000H H %
121 % (1) (2) (3) (4) (5) (6) (7) (8) (9) (10) A 117
122 14,225 33,579 33,579 (%) % , % 2 14, , %50%
123 ,592,366 A 331,117,788 A30%A 88,112, ,112,886 A30% (1) (2) (3) A A ,323,384,991 1,323,384,
124 H H(1)594,056,000 (2) (3) (4) H (a) (b) (c) (a) (b) (c) (d) HH % HH 2014 H 10%
125 H HH HH % H10%10% < > H H H 121
126 (2015) ) (1) (2)
127 , , , ,236 1, ,841 27,241 65, ,215 30,253 27, ,311 3, , , , ,387 28,949 28, ,740 24,205 18, ,983 8,033 8, ,520 8,924 6, ,587 13,839 9, ,908 12, ,886 26,107 18, ,053, , , , , , , , , , , , , , , ,898 12,081 9, ,037 11,791 11, ,589 10,961 10, ,371 18,264 15, ,408 16,841 15, ,794 32,103 25, ,354 15,253 10, ,585 50,982 23, ,250 39,603 36,241 4,005,911 3,360,312 2,844,
128 ,901 10,391 3,566 2,754 2,264 16, , , , ,119 25,482 39,268 4,747 3,692 1, ,770 2, , , , ,496,104 1,181, , ,344 10,043 7, ,721 2,618 3,615 5,029 5,014 4, ,452 16,058 11,179 4,725 3,495 2, ,746 12,303 6, ,013 12,060 9, ,623 8,244 5, ,068 17,106 11, ,737 22,503 17, ,673 25,232 21, , , , , , , ,635 23,656 9, ,119 56,756 38, ,160 6,238 5, ,093 35,182 13, ,250 39,603 36,241 3,652,095 3,120,607 2,634,
129 ,892 7,916 7, ,374 87,544 83, ,884 (4,427) ,470 6,982 6, ,196 14,680 10, ,748 70,014 49, , , , ,252 56,996 50, , , ,649 4,005,911 3,360,312 2,844,
130 , , (24,660) (21,034) 55 (12,984) (7,818) 288, , ,422 93, (64,527) (50,861) 56 54,895 42, ,643 15, (3,230) (1,979) 57 22,413 13, ,735 54, (191) (381) 60 17,636 11, , ,631 (10,188) (7,574) 61 (102,659) (90,663) 12,532 9, (108,419) (94,545) 63 1,596 2,126 (5,871) (5,311) (4) (7) (34,937) (25,383) 64 (15,915) (11,962) 65 (85,665) (69,168) 7,963 6,584 (6,974) (3,202) 65 (27,104) (17,431) 66 (24,896) (8,966) (400,541) (316,292) 126
131 ,341 46, (500) (520) 62,353 46, (14,423) (10,210) 47,930 36,014 39,279 28,154 8,651 7,860 47,930 36, (8) (10) 37,816 (7,036) (7,075) ,774 (6,212) 78,704 29,802 69,590 22,930 9,114 6,872 78,704 29,
132 ,916 87,544 (4,427) 6,982 14,680 70,014 56, ,705 39,279 8,651 47, , ,774 30,311 39,279 9,114 78,704 H ,248 28, ,615 13, (5,541) (5,541) 488 (488) 4,516 (4,516) (1,078) (1,078) (15) (1,103) (1,118) (7) (11) (105) (116) 8, ,374 25,884 7,470 19,196 98,748 64, , ,916 83, ,982 10,861 49,637 50, ,649 28,154 7,860 36, (5,224) (988) (6,212) (5,224) 28,154 6,872 29, (3,958) (3,958) 3,819 (3,819) (834) (834) 1,097 1, (361) 46 3,731 3, ,916 87,544 (4,427) 6,982 14,680 70,014 56, ,
133 , , , , ,985 31, ,717 87,076 22,911 69,392 1,306 24,114 10,778 72(3) 26,158 20, , ,557 (97,044) (85,726) (6,439) (2,298) (3,325) (2,546) (183,973) (135,467) (70,215) (18,271) (13,936) (92,836) (70,080) (40,623) (30,861) (30,133) (21,065) (6,353) (42,367) (10,406) (11,751) (266) (903) (2,867) (20,773) (14,412) 72(4) (99,710) (62,958) (664,963) (512,641) 72(1) 170, , , ,426 88,403 73, ,278 1, , ,
134 (1,071,077) (1,081,578) (13,530) (10,083) (11,703) (7,559) (1,226) (1,212) (658) (1,098,748) (1,099,878) (236,889) (236,063) 29,181 1, ,192 37,792 16,980 66,766 29,600 44,558 12, ,297 60,071 (45,764) (12,215) (14,194) (15,401) (1,111) (839) (9,691) (23,339) (23,280) (2,229) (92,929) (53,184) 85,368 6, (749) 72(2) 19,083 (2,009) 244, ,886 72(5) 263, ,
135 ,214 4,159 8, ,613 8,888 6, ,486 1, ,500 1, ,133 2,115 1,880 1, , , , , , , , , ,970 1,700 1, ,200 4,430 4,230 9,131 22, ,331 29,414 6,220 8,892 7,916 7, ,317 87,454 83, (163) (102) 7,470 6,982 6, ,546 32,361 27, , , , , , ,
136 ,909 9, ,392 9,611 (22) (15) 11 (664) (508) (1,489) (449) (2) (1) (2,177) (973) 7,215 8, (3) (7) 7,214 8, ,214 8, (61) (61) 7,449 8,
137 ,916 87,454 (163) 6, , ,945 7,214 7, ,214 7, ,248 28, ,615 13,997 (5,541) (5,541) 488 (488) 8, , , , , ,916 83,817 (102) 6, , ,695 8,632 8, (61) (61) (61) 8,632 8,571 (3,958) (3,958) (94) (94) 3,731 3,731 7,916 87,454 (163) 6, , ,
138 (230) (213) (11) (24) (684) (365) (925) (602) 14(1) (88) (368) 34,984 23,135 8,522 10, ,506 33,253 (57,835) (49,830) (4) (2) (57,839) (49,832) (14,333) (16,579) 28,842 5,970 2,700 26, ,812 28,900 (4,930) (2,000) (5,939) (4,281) (400) (11,269) (6,281) 23,543 22, (2) 9,218 5,672 17,645 11,973 26,863 17,
139 2014 ) H) A ) ) )2002 )) ,081 18,138 (6,057) 9,960 15,895 (5,935) 236, ,806 6, , ,976 5,
140 ,544 83,006 4,538 83,424 84,121 (697) 111 (111) 100 (100) (4,427) (4,427) , ,285 10, ,466 70,014 84,299 (14,285) 49,637 60,103 (10,466)
141 )
142
143
144
145 8. (1) (2) (a) (b) 141
146 (1) (2) (3) (4) 142
147 8. (1) (2) (3) (4) 143
148
149 8. 145
150 %
151
152 % - 10% 2.25% % % % - 10% 2.25% % % 6% % % - 10% 9% %
153
154
155 20. [2008]2 0.8% 0.08% 0.05% 0.15%0.05% 0.8%0.15% 0.8% 0.08% 0.05% ) ) 1% 6%
156 )
157 22. Bornhuetter-Ferguson 153
158
159
160 (1) (2) 156
161
162
163 (1) (2) (3) , ,
164 (1) (2) 5% 100% 1% (3) (4) 8 160
165 41. (5) % % % %) % % %- 5.50%) ( ) 161
166 (5) 85% 3% 6% 2.5% 5.5% 40 (6) (7) (8) , ,
167 41. (9) 5% [1994]2 17% 30% - 60% % %) 163
168 % 99.51% 33,800,000, % 99.51% 21,000,000, % 8.80% 59.00% 11,424,894, % 99.88% 6,988,000, % 86.77% 5,500,000, % 15.40% % 4,360,000, % 3.98% % 500,000, % 3.75% 75.01% 666,577, % % 4,735,000, % % 490,000, % 25.00% % 7,500,000, % % 145,000, % % 4,000,000, % % 10,000,000,
169 IT % % 30,000, % 70.00% 350,000, % % 30,000, % 60.00% 200,000, % 99.94% 312,000, % % 300,000, % % 1,800,000, % % 1,251,363, % % 100,000, % % 4,330,500, % % 50, % 17.18% % 4,256,000,
170 % 67.00% 50,000, % 80.00% 100,000, % % 30,000, % 60.70% 300,000, % % 4,800,000, % % 50,000, % % 50,000, % % 50, % % 50, % % 419,000, % % 500,000, % % 300,000, % 60.00% 750,000, % 60.00% 504,000, % % 600,000,
171 % % 200,000, % % 280,000, % % 50,000, % % 800,000, % % 200,000, % % % % 90,000,000 YONG SUK CHO 99.51% % 256,323, % % 840,000, % % 500,000, % % 1,380,000, % % 1,160,000, % % % % 62,200, % % 54,700, % % % % % % 1 167
172 % % 1,000,000, % % 1,600,000, % % 45,000, % % 50,000, % % 268,261, % 27.51% 672,443, % % 4,810,000,000 ZHOU Xiaofeng 94.74% 94.74% 63,330, , , , , ) ,500100% 100%100% ) 74.91% 75.00% % 168
173 % 12,000,000, % 10,000,000, % 9,500,000, % 6,190,000, % 5,166,472, % 5,000,000, % 4,090,000,
174 %95% % 0.10% 170
175 , , ,423 (4,619) (20,041) (24,660) 515 (13,499) (12,984) 179, , ,779 53,026 1,869 54,895 (1,869) 1,869 17,444 2,854 2,002 2,631 (2,518) 22, ,108 (2,518) 62,319 6,740 3,131 1,682 1,721 1,677 3,394 (1,929) 78,735 1, (1,929) 28 (24) 4 (70) (62) (10) (49) (4) (388) (191) 7, ,645 (11,946) 17,636 4, ,663 (11,946) 249, ,042 73,416 5,186 3,826 2,160 25,894 (14,524) 462,882 (10,188) (10,188) (37,527) (65,132) (102,659) 3,459 9,073 12,532 (99,982) (8,437) (108,419) 272 1,324 1,596 (5,871) (5,871) (4) (4) (22,797) (15,446) 3,306 (34,937) (1,150) (8,050) (5,482) (277) (195) (22) (739) (15,915) (22,856) (24,692) (27,215) (1,195) (1,908) (664) (12,618) 5,483 (85,665) 966 6,997 7,963 (1,511) (238) (648) (483) (1,489) (2,654) 49 (6,974) (24,667) (201) (133) (218) (4) (1) (7,877) 5,997 (27,104) (8,841) (292) (15,011) (93) (40) (619) (24,896) (230,693) (105,098) (47,841) (2,431) (2,630) (2,176) (24,507) 14,835 (400,541) 171
176 ,189 11,944 25,575 2,755 1,196 (16) 1, , (56) (79) (277) (3) (42) (3) (40) (500) 19,279 11,980 25,338 2,757 1,164 (17) 1, ,353 (3,590) (3,173) (6,191) (558) (240) (671) (14,423) 15,689 8,807 19,147 2, (17) ,930 15,969 5, ,268 3,610 16,223 26,214 15,145 (12,807) 442,707 45,841 45,841 12, ,811 3,412 6,613 4,028 (1,575) 51,215 5,233 3, ,636 7, , ,177 9,925 5,058 14,983 37,908 37,908 9,920 1,016, ,147 9,162 1,053, ,359 49, ,337 (27,874) 209, ,997 17,471 1,493 21,990 18,357 16,087 10,398 (3,358) 351, ,561 36, ,838 1, , ,377 22, , ,400 1,041 (13,925) 429,216 7, , ,159 (599) 12, ,530 58,043 96,330 8,464 14,658 11,043 32,199 (11,212) 376,055 1,382, ,450 2,202,449 36,628 61,878 62, ,269 (62,188) 4,005,911 2, ,970 12,959 (279) 20, ,451 (4,707) 380,744 55,623 1,200 22,568 2,730 17, ,672 1,533,183 (37,079) 1,496,104 14,899 (555) 14,344 1, ,721 28,673 28, , , , , ,748 5,589 5,356 1,200 26,282 (1,792) 36,635 21,335 5,663 41,750 2,996 9,131 7,244 88, ,994 27,860 87,361 14,368 16,497 1,029 33,462 (5,285) 286,286 1,304, ,730 2,072,196 24,626 51,680 17,330 81,127 (49,697) 3,652,
177 , , ,675 (74) 14,394 1, , ,068 (43) 5,388 8, , , , , ,051 (4,447) (16,587) (21,034) (11) (7,807) (7,818) 148,919 91, ,199 40,894 1,536 42,430 (1,536) 1,536 10,456 2,117 1, (1,007) 13, (278) (2) 1,144 (1,007) 46,044 5, ,466 1, ,073 (1,584) 54,917 1, (1,584) (36) (4) (355) 1 (264) (78) (1) 711 (52) (146) (36) (163) 7 4 (47) (381) 6, ,062 (9,068) 11,034 4, ,682 (9,068) 201,131 97,334 52,394 4,141 2,639 1,226 13,889 (10,123) 362,631 (7,574) (7,574) (32,926) (57,737) (90,663) 2,511 6,699 9,210 (89,156) (5,389) (94,545) 851 1,275 2,126 (5,311) (5,311) (7) (7) (15,798) (11,479) 1,894 (25,383) (602) (6,486) (4,065) (200) (142) (15) (452) (11,962) (19,325) (21,202) (21,826) (1,003) (1,533) (508) (8,164) 4,393 (69,168) 877 5,707 6,584 (1,055) (397) (225) (448) (1,099) 22 (3,202) (17,822) (121) (46) (34) (11) (1) (3,113) 3,717 (17,431) (1,259) (240) (6,890) (250) (45) (282) (8,966) (186,589) (89,377) (32,827) (1,712) (1,731) (972) (13,110) 10,026 (316,292) 173
178 ,542 7,957 19,567 2, (97) 46, (66) (114) (35) (2) (266) (7) (30) (520) 14,580 7,926 19,643 2, (97) 46,224 (2,361) (2,070) (4,739) (477) (138) (425) (10,210) 12,219 5,856 14,904 1, (97) 36,014 24,652 5, ,837 3,315 10,836 4,159 8,995 (9,388) 349,442 27,241 27,241 8,949 2,346 10,421 2,884 8,888 1,207 (4,442) 30,253 5,205 1, ,692 3,348 13,486 2, ,080 7, ,033 12,985 12,985 13, , ,882 (2,521) 861, ,440 44, , (25,001) 200, ,563 9, ,046 13,217 2,116 11,558 (1,127) 236, ,409 33, , ,070 86,840 14, , (10,132) 276,332 7, , ,796 (4,974) 12, ,015 48,491 63,940 8,820 7,283 8,938 24,543 (6,252) 302,778 1,171, ,758 1,895,602 29,775 37,638 44,236 85,754 (63,837) 3,360,312 3, ,700 4,792 (130) 10, ,788 (3,115) 447,673 64,394 1,830 36,049 4,724 14, ,642 1,217,002 (35,530) 1,181,472 10,297 (68) (186) 10,043 2, ,618 25,232 25, , , ,083 93, ,666 5,963 5,091 4,430 10,615 (2,443) 23,656 13,173 7,702 8,109 22,188 5,584 56,756 84,405 25,415 69,469 11,596 4, ,085 (7,008) 212,162 1,128, ,852 1,783,566 25,361 28,976 29,414 44,626 (48,412) 3,120,607 7, , (74) 10,004 1, , ,748 1, , ,
179 ,168 3,738 67,575 46,201 14,502 9, , , , ,291-6,221 3,332 49,238 26,652 1,936 1,918 66,477 71,914 2,348 1, , , % %)5% %) , ,
180 , ,168 46,742 9,446 11, , ,985 6, ,139 51,290 7,485 5,765 1,937 66,477 2, , ,033 23,679 17,958 2, , , ,738 40,028 1,233 4, , ,013 3, ,193 65,556 3,043 1,374 1,941 71, , ,137 8,286 6,650 2, , ,235 57,420 2,533 9,554 12,775 4,991 66,543 71,965 (66) (51) 66,477 71,
181 , , ,236 1,554 ) ,708 26,830 2, ,865 27,264 (24) (23) 45,841 27, , ,927 7,214 17,711 7,649 16,679 12, ,251 2, ,384 29,
182 ,215 30,253 3,144 2,179 48,071 28,074 51,215 30, , , ,902 1, ,874 1,882 29,117 1,873 10, , ,653 4, ,565 2, , , ,363 2, ,039 2,374 14, , ,196 3, ,035 2,
183 , ,138 15,625 58,288 50,807 55, ,748 2, , ,115 (28) (35) 197, , , ,432 3,368 2,038 1,974 31,277 31,277 13,925 13,
184 ,214 5,885 7,710 4,600 18,527 15,123 1,936 3,341 35,387 28,949 5% ,302 24,537 (562) (332) 30,740 24,205 6,615 7,630 24,125 16,575 30,740 24,205 5% ,482 23, ,302 24,
185 , % (543) 34.72% 29, % (19) 0.06% 31, % (562) 1.80% , % (305) 27.38% 23, % (27) 0.12% 24, % (332) 1.35% , % (18) 0.06% % % (1) 1.49% 29, % (19) 0.06% , % (17) 0.07% % (3) 0.51% % (7) 26.92% 23, % (27) 0.12% 181
186 % 0.89% ,261 6,968 3,429 1,092 15,690 8,060 (707) (27) 14,983 8,033 5% ,549 8,941 (29) (17) 7,520 8, ,397 8, ,549 8,941 5%
187 , % (12) 0.55% 5, % (17) 0.32% 7, % (29) 0.38% , % (2) 0.05% 5, % (15) 0.29% 8, % (17) 0.19% , % % (2) 4.55% % (15) 33.33% 5, % (17) 0.32% , % % (1) 2.56% % (14) 22.95% 5, % (15) 0.29% 183
188 ,994 6,841 7,036 5, ,587 13, ,484 13,148 (576) (163) 37,908 12, % 90.00% % 90.00%) % 9.00% % 9.00%) 14. (1) , ,733 12,413 12, ,896 89, ,445 86,834 55,365 64,956 65,495 48,747 46,114 36,139 1,075, ,179 (21,355) (15,409) 1,053, ,
189 14. (2) ,261 2,565 41,520 29, , ,731 15,294 15,792 35,076 40, , , ,668 86,429 65,768 48,011 43,578 33,433 44,130 24, , ,733 12,413 12, , , , ,108 1,075, ,179 (3) , , , , , , , ,738 1,062, ,841 12,413 12,338 1,075, ,
190 (4) ,934 4, ,047 3,240 4,590 1, ,782 6,227 6,931 6, ,298 2,484 2,670 1,890 7,044 16,885 18,575 10, , ,915 2, ,501 1,794 2, ,319 4,206 4,927 3, ,927 1,105 1, ,198 10,020 11,213 5, ,945 1 (5) , % 273, % 367, % 313, % 115, % 89, % 222, % 176, % 44, % 23, % 1,075, % 877, % 186
191 14. (6) ,933 13,476 15,409 2,138 10,706 12, ,640 8,974 14,614 3,126 3,583 6,709 (5,420) (3,681) (9,101) (3,130) (1,165) (4,295) (313) (313) (403) (403) (2) (9) (11) (2) (15) (17) 2,220 19,135 21,355 1,933 13,476 15, , ,796 6, ,152 3, ,031 59, ,765 30, ,084 72, ,769 17, ,500 11, , ,
192 (1) ,764 7,117 27,857 21,202 90,505 66,206 35,417 34, ,812 87,246 40,016 14, , ,806 4,064 6,057 4,064 6, , , , , , , , ,
193 16. (2) ,126 94, , , (8,078) - (37) (36) - 217, , , ,081-44,103 2,926 - (31,119) (23,726) - 347, , , ,720-44,403 (5,152) - (31,156) (23,762) - 4,266 6,312 - (202) (255) 351, ,
194 (3) (36) (23,981) (24,017) (8,934) (8,934) (8,859) (8,859) 1,594 1,594 (1) (1) (37) (31,321) (31,358) (38) (24,978) (25,016) (1,540) (1,540) (1,502) (1,502) 2 2,537 2, (36) (23,981) (24,017) 50%
195 , , , , , , , ,071 (2) (1) 783, ,070 81,877 78, , , , , , , ,795 87, ,922 4, , , ,697 71,892 52,656 67,509 18, ,461 6,220 (350) 429, ,
196 ) ) (348) ) ) 808 (27) ) 6,300 6,300 ) (156) 522 2, (95) 2, , (227) 10,908 (348) 64 ) 1,751 (69) 1, , (53) 1, ,081 1,097 (280) 12,898 (348)
197 (82) 233 (348) (79) ,300 6, , ,209 (20) 38 9, ,247 (368) (79) 85 1, , , , ,960 1, ,081 (368) (79)
198 % 1, % 1, (131) 45.00% % 7,341 4, % 16, % 2,172 1, (346) 49.94% 2, % 1, % (7) 45.00% (46) 29.85% 7,866 5, % 16, % 1, (224) 49.94% 4,
199 ,761 8,761 2,502 2, , ,037 11, , ,761 8,761 2,502 2, , ,791 11, , % 14% % 14%) 3% 34% % 36%) 195
200 ,760 6,760 3,800 3, ,589 10,961 20% 5% , , (602) (602) (28) (28) (986) (986) 20, ,598 2, , (160) (160) (7) (7) (108) (108) 3, , , ,371 18, ,264 32, ,473 32, ,
201 , , ,097 4,097 (77) (77) (199) (199) (204) (204) 20, ,993 2, , (63) (63) (8) (8) (12) (12) 2, , , ,264 14, ,049 32, ,364 31, , , , , ,129 3, , , ,
202 ,100 8,056 1,468 2,598 26, , ,670 11, (348) (268) 943 (341) 602 (102) (102) (271) (680) (280) (155) (1,386) 15,038 9,022 1,419 11,424 36,903 3,807 4, , , , (26) (26) (113) (589) (81) (783) 4,371 5, , (3) (3) ,572 3, ,424 26,408 10,195 3, ,598 16,
203 ,950 7,254 1,196 1,407 23, , ,687 3, (104) (75) 98 (21) 77 (56) (539) (42) (371) (1,008) 14,100 8,056 1,468 2,598 26,222 3,209 4, , , (16) (444) (39) (499) 3,807 4, , (14) (11) (25) ,195 3, ,598 16,841 10,629 3, ,396 15, ,
204 , (367) % 12,764 2,449 1,254 3, % 5,261 4,476 4, % 2,088 1,163 1, % 24 2,393 (477) 1,940 2,598 9,670 (844) 11, , % 12,974 1,070 1,379 2, % (485) 24 1,396 1,687 (485) 2, ,232 5,409 15,082 2,155 4,036 37, (16) (16) (100) (25) (125) 11,232 5,337 15,082 2,155 4,716 38,522 1, , ,068 5, , (4) (4) (6) (5) (11) 1, , ,642 7,728 9,487 4,822 12,443 1,968 2,074 30,794 9,973 4,940 13,197 2,025 1,968 32,
205 ,672 4,026 15,082 2,155 3,810 29,745 6,560 6,560 1, , (25) (40) (65) 11,232 5,409 15,082 2,155 4,036 37, , ,570 4, , (2) (23) (25) 1, , ,068 5,811 9,973 4,940 13,197 2,025 1,968 32,103 3,676 3,619 13,951 2,082 2,240 25, , ,973 4, ,
206 ,354 15,253 (6,160) (6,238) 6,194 9, (144) 13 (52) 8,168 2,234 (12,564) (73) (2,235) 8,940 (63) 1,793 2, ,259 (17,036) 3, ,307 (1) 5,417 (21,668) 3, ,900 (19,600) 15, ,907 (10,205) ,354 (49,416) (628) 6,276 (285) 2,184 (7) 8,168 (32,672) (64) 272 (271) (63) 252 1,988 1,116 3,104 (12,416) 2, (110) 3,887 (15,548) 10, ,137 1,913 (117) 15,253 (61,012) 202
207 (3) (10) (13) 52 (112) 21 8 (83) 332 (3,298) 189 (3,109) 12,436 (2,825) 46 (55) (121) (2,955) 11,820 (6,238) 225 (34) (113) (6,160) 24, (3) (3) 12 (222) (91) 201 (112) 448 (3,487) 189 (3,298) 13,197 (1,890) (827) (127) 19 (2,825) 11,300 (5,599) (827) (32) (6,238) 24, , ,
208 ,254 21,286 26,546 17,260 2,713 3,511 2,494 2,207 2,506 1,764 1,622 1, ,978 4,214 85,968 52,219 (1,383) (1,237) (593) (516) (428) (437) (13) (238) (204) (111) (80) 84,585 50,982 5% [2009] ,432 11, ,913 1, , ,074 26,546 17,
209 , % (308) 6.55% 21, % (285) 1.30% 26, % (593) 2.23% , % (373) 6.64% 11, % (143) 1.23% 17, % (516) 2.99% , % (70) 0.38% , % (40) 1.61% % (67) 14.60% % (108) 28.05% 21, % (285) 1.30% , % (32) 0.32% , % (30) 2.59% % (27) 12.50% % (54) 25.59% 11, % (143) 1.23% 205
210 ,523 6, % 40.23% (1) 9 ))) )) ))) ) (2) , , , , , , , , , ,
211 27. (3) ,452 8,426 25,778 20,932 3,136 3, ,224 5, ,250 39,603 4,305 1, ,687 37, ,250 39,603 (4) 0.2%2% 1.2% 1% 1.5% 1.5% (5) 207
212 (3) (7) (7) (1) (42) (43) 1, , ,614 (8,697) (8,697) 21, ,981 8,934 (1,594) (1,594) 31, (20) (20) (3) (3) 95 1, (5) (163) (168) 1,383 41, ,912 (16) (10,514) (10,530) 56, (1) (1) (8) (16) (24) , ,709 (4,323) (4,323) 15, (2) (2) 36-24,978 1,540 (2,537) (2,537) 23,981 5 (3) (1) (4) (25) (25) (3) (106) (109) 1,237 39, ,980 (14) (7,011) (7,025) 41,
213 ,991 9, , ,901 10, , , , ,769 16, , , ,551 22,633 3,568 2,849 15,119 25, , , ,261 2,730 4, , , , , , , , , ,
214 , , , , , , ,707 98, , ,338 31,460 37,189 36,212 2,702 2,556 1,496,104 1,181, , ,951 5,946 1,393 4,097 14,344 10, ,883 2, ,721 2,618 5% % 1 210
215 ,153 11, ,746 12,303 5% , ,242 (32,785) 14, ,906 (6,851) ,156 (983) (4) 1 12, ,307 (40,623) 17, ,643 4,347 2,786 2, ,700 1, ,623 8, ,120 15,582 2, ,068 17,106 5% 211
216 % % , ,095 81,021 75,058 21,898 11,789 (44,462) (28,465) (52) (58) (15,553) (15,123) 353, , ,712 38, ,110 60, ,366 47, , , , ,
217 , ,324 (116,183) 74, (26) 8 37,044 80,237 (71,133) 46, (14) (35) , ,776 (40,652) (15,539) ,886 65,965 18,022 (11,692) (3,030) , , ,367 (123,512) (18,569) (115,204) 844, , ,728 (93,519) 60, (70) 12 31,204 68,193 (62,353) 37, (104) , ,455 (36,541) (12,251) ,483 58,546 18,775 (8,839) (2,728) , , ,207 (107,837) (14,979) (92,651) 718,
218 ,710 29,406 37,443 23, ,393 13,755 26,816 10, (31,839) 686,725 (30,079) 584, ,709 1,318 64,647 46, ,641 35, , ,363 28,081 13,286 7,280 2,499 1,683 46,148 37, ,338 (1,557) 722, ,448 (1,381) 619,067 4,627 (267) 4,360 4,635 (283) 4, ,783 (13,763) 102,020 93,583 (12,175) 81, ,748 (15,587) 829, ,666 (13,839) 704,
219 ,965 12,837 2,417 3,535 4,014 3,392 4,239 3,892 36,635 23, ,000,000, % 1, ,500,000, % 1,497 1, ,100,000, % 2,090 2, ,000, % ,000, % ,779,327, % 1, ,000,000, % % 2, ,500,000, % % ,000,000, % % 2,613 2,586 3,050 3, ,000,000, % % 4,112 4, ,000,000, % % 9,191 9, ,000,000, % % 8, ,150,000, % % 1, ,850,000, % % 1,
220 ,500,000, % % 1,464 1, ,650,000, % 3,650 3, ,000,000, % 6, ,000,000, % 9, ,900,000, , ,521, % 357 A ,000,000, % 1.00% 1.20% 1.80% 2.20% 2.60% 9,131 22, ,000,000, % 2,996 88,119 56,756 1 ) A) %2.60% ) A108% A130%130%) 3,000 A 80% H , ,971,800 A A %
221 ,000 (184) (3,731) 22,085 22, , (13,997) , ,124 13,765 8,594 12, ,150 2, ,095 (1) 2,058 1,600 9,164 3,070 78,093 35,182 5% (1) (11) (16) (27)
222 A H ,786 3,130 7,916 (1) (2) ,168 3,724 8,892 (1) H [2014]126 [2014] ,056,000H ,248H (2014) 798 (2) ,971,800 A38213,615 (2014) 798(2015) (1) 127,991 83,868 (2) 1,383 3, ,374 87,544 (1) AH 2014 H 28,248 A 15,875 (2) A2, ,446 3,958 3,024 3,024 7,470 6,982 10% 50% 25% % 2014 HA 8, % , ,297 8, ,
223 51. 10% 1.2% 10% 5% 5% 10% 52. (1) (2) 10% (3) (4) ,562 2, ,979 1, A ,371A7,916,148,463 3,
224 ,404 45,998 7,573 7,282 1,183 1, ,438 1, ,291 64,252 56, (1) , ,032 (4,784) (4,352) (64,673) (61,629) 326, ,051 (2) , , , ,
225 54. (3) , ,341 13,837 11,176 9,852 7, , , ,667 90,091 29,257 22,850 3,226 2, , , , , , ,539 13,813 11,151 9,775 7, , ,930 96,176 79,374 23,736 17,023 3,198 2, ,110 99, , , ,830 7, (155) 12,984 7,
226 ,885 3,315 20,417 19,188 37,492 30,697 33,599 22, ,218 17, ,422 93, ,778 24,457 36,063 25,716 1, ,527 50,861 54,895 42, , ,503 2,226 19,770 11, ,643 15, ,320 1, ,230 1,979 22,413 13,
227 ,818 24,100 6,060 5, ,809 4,264 11,846 11, , ,393 3,143 3,026 2, ,397 3, (285) (483) 309 (60) 254 (551) (522) (18) (110) (387) 7,039 2, (174) (151) 240 2, (62) (264) (3,383) (3,523) 78,735 54,
228 (159) 20 (11) 268 (1) (132) ,306 4,731 1, , ,411 1, , , ,351 1,536 17,636 11, (1) ,624 90, ,659 90,663 (2) ,168 62,457 17,405 15,910 5,587 5,292 8,499 7, ,659 90,
229 62. (1) ,103 5,819 (49) (74) 96,080 81,383 3,285 7, ,419 94,545 (2) ,386 3,329 6,006 2, ,103 5, ,418 1, ,596 2, ,128 10,506 1, ,915 11,
230 ,700 24,350 8,870 7,959 16,977 11,789 1,616 1, ,763 1,706 1,923 1, ,156 4,251 8,637 6,223 1,225 1,381 2,698 2, ,834 1, ,967 1, ,614 6,709-8,934 1, ,896 8,
231 ,962 12,145 - (407) 170 (7,132) (2,105) 14,423 10, ,353 46,224 25% %) 15,588 11,556 3,063 1,248 (3,821) (2,764) (407) ,423 10,
232 (1) ,279 28,154 7,962 7, ,916 7,916 H ,962 7,916 (2) ,279 28, ,138 28,248 7,962 7, ,582 7,
233 (4) (4) (8) (4) (4) (5,472) 37,315 31,843 46,869 3,490 (12,543) 37, (7,041) (6,107) (9,457) 23 2,359 (7,041) (34) (4,427) 30,311 25,884 37,445 3,513 (10,184) 30, (6) (10) (6) (4) 576 (6,048) (5,472) (8,144) (1,277) 2,385 (6,048) (988) , (271) (5,224) (4,427) (7,068) (1,258) 2,114 (5,224) (988) 229
234 (1) ,930 36,014 24,896 8, ,763 1,706 1,923 1, (22) (615) (596) (103,364) (73,373) ,974 3, , ,237 (7,132) (2,105) (290,483) (220,451) 366, , , ,916 (2) , ,786 (141,786) (194,628) 71, ,091 (103,091) (52,258) 19,083 (2,009) 230
235 72. (3) ,539 5,214 1, , (4) ,637 6,223 5,156 4,251 10,188 7,107 1,967 2,797 24,477 19,514 12,801 3,137 (5) ,168 3,738 64,896 38,148 49,238 26,652 27,042 48,826 1,634 1,217 1, ,898 22, , ,786 4,668 3,033 66, ,058 71, , , ,
236 (1) ,311 3,402 4,311 3,402 51,215 30,253 51,215 30, , , , , , , , , , , , ,442 2,236 1,554 2,236 1,554 45,841 27,241 45,841 27, , , , ,080 35,387 28,949 35,387 28,949 30,740 24,205 30,740 24,205 14,983 8,033 14,983 8,033 7,520 8,924 7,520 8,924 37,908 12,985 37,908 12,985 37,886 26,107 37,886 26,107 1,053, ,770 1,054, , , , , , , , , ,332 11,589 10,961 11,589 10,961 26,834 4,739 26,834 4,739 2,583,003 2,139,706 2,583,089 2,140,065 3,773,461 3,154,294 3,779,382 3,099,
237 73. (1) ,770 2,918 2,770 2,918 4,747 3,692 4,747 3,692 20,901 10,391 20,901 10,391 2,754 2,264 2,754 2, , , , ,673 15,119 25,482 15,119 25,482 99, ,642 99, ,642 1,496,104 1,181,472 1,496,104 1,181,472 14,344 10,043 14,344 10,043 2,721 2,618 2,721 2,618 4,725 3,495 4,725 3,495 8,746 12,303 8,746 12,303 26,068 17,106 26,068 17,106 27,737 22,503 27,737 22,503 28,673 25,232 28,673 25, , , , ,296 36,635 23,656 36,635 23,656 88,119 56,756 90,594 56,024 61,540 19,889 61,540 19,889 2,667,750 2,292,821 2,670,225 2,292,089 2,675,267 2,299,431 2,677,742 2,298,
238 (1) 3 (2) 234
239 73. (2) ,996 28,838 30,834 16, , , ,772 20,228 30, , ,922 1,922 1,874 1,874 4,311 4,311 31,757 98, ,126 33,762 1,655 35, ,613 18, , ,010 14,956 40, , ,919 15, , , ,770 15, , ,882 1, ,770 2,770 4,747 4,747 4,747 2,770 7,
240 (2) ,786 15,523 10,617 2,021 12,638 1,251 1, ,605 17, , ,118 2, ,402 3,402 19,578 74, ,525 32,817 1,271 34,088 84,252 2, , ,676 3,250 14, ,668 90,855 3, , , ,754 3, , ,374 2, ,918 2,918 3,692 3,692 3,692 2,918 6,
241 73. (2) , ,747 1, ,332 41, ,747 1, ,332 90,594 90,594 90,594 90, , , ,797 36, , ,797 56,024 56,024 56,024 56, (60) (135) (11) 11 3, ,066 3, (12) 15,270 3,
242 (2) ,105 6, ,865 12,
243 1. (1) (2)
244 (3) % 10% 10% 5% (1,250) (1,247) 1,247 1, ,015 3,009 (3,009) (3,009) +10% 9,142 8,573 (8,573) (8,573) -10% +10% 4,697 4,712 (4,712) (4,712) +5% 1,683 1,683 (1,683) (1,683) (3,918) (3,838) 3,838 3, ,053 4,944 (4,944) (4,944) +10% 8,026 7,528 (7,528) (7,528) -10% +10% 3,446 3,460 (3,460) (3,460) +5% 1,423 1,423 (1,423) (1,423) 240
245 1. (3) ,796 38,655 51,312 60,361 69, ,648 38,360 51,966 60, ,767 37,780 51, ,417 37, ,225 26,225 37,475 51,727 60,876 69, ,155 (25,631) (35,779) (48,350) (52,712) (43,244) (205,716) 40,439 3,190 43,
246 (3) ,977 34,486 45,307 52,810 59, ,977 33,912 45,702 53, ,954 33,363 45, ,636 32, ,479 23,479 32,984 45,469 53,124 59, ,920 (22,976) (31,772) (42,670) (46,484) (37,189) (181,091) 33,829 2,912 36, ,326 3,739 4,301 4,877 6, ,358 3,547 4,173 5, ,384 3,534 4, ,383 3, ,383 3,383 3,534 4,182 5,066 6,732 22,897 (3,383) (3,534) (4,182) (4,884) (4,382) (20,365) 2, ,
247 1. (3) ,371 3,495 4,181 4,717 6, ,386 3,286 4,042 4, ,442 3,330 4, ,442 3, ,442 2,442 3,299 4,050 4,862 6,367 21,020 (2,442) (3,299) (4,050) (4,687) (4,155) (18,633) 2, , % 2,181 1,831 (1,831) (1,831) +5% (125) (125) % 1,760 1,481 (1,481) (1,481) +5% (99) (99) 243
248 (3) 2. (1) % % 579 1, % (6) ,020 1, ,269 5% (447) (532) (132) (195) 5% (579) (1,289) (204) (899) 5% 6 (129) (15) (175) (1,020) (1,950) (351) (1,269) 244
249 2. (1) ,033 23,679 17,958 2, ,707 2, ,236 31,455 14, ,841 50, , , ,177 33,967 1, ,387 29, ,740 14, ,983 7, ,520 13,951 1, ,587 37,908 37,908 37,886 37, , ,763 5,069 1,165 1,053, , , ,870 1,684 14,185 2, , , , , ,216 11,589 11,589 24,432 2, ,834 3,591, ,338 39,481 6,293 3,784,
250 (1) ,850 1,051 20,901 2,754 2, , , ,744 10,042 5, ,119 4,747 4,747 99, ,672 1,304, ,275 17,179 2,393 1,496,104 13, ,344 2, ,721 4, ,725 8, ,746 17, ,013 25, ,068 27, ,737 28, , , , ,271 2, ,748 36, ,635 88,119 88,119 57,955 2, ,540 3,326, ,015 19,118 4,397 3,534,258 (36,677) 20,363 1,896 (14,418) 47,307 5, ,390 10,630 25,770 2,572 38, ,145 41,989 2, ,
251 2. (1) ,137 8,286 6,650 2, ,442 1, ,554 20,432 6, ,241 30, , , ,080 28, ,949 23, ,205 8,033 8,033 8, ,924 12,283 1, ,839 12,985 12,985 26,107 26, ,657 67,432 3, , , , ,506 1,260 13,912 3, , , , , ,332 10, ,961 17, ,724 3,059,699 87,244 24,937 5,836 3,177,
252 (1) , ,391 2,264 2, ,041 5, , ,673 7,320 18, ,482 3,692 3, , ,642 1,082,406 90,993 5,699 2,374 1,181,472 9, ,043 2,618 2,618 3, ,495 11, ,303 12, ,060 16, ,106 22, ,503 25, , , , ,323 1, ,666 23,656 23,656 56,756 56,756 19, ,889 2,885, ,418 7,346 16,213 3,027,239 (31,174) 17,591 (10,377) (23,960) 35, ,868 49,340 3,902 17,987 3,491 25, ,088 20, ,
253 2. (2) % 99% ,705 8, % 10,705 (3) 249
254 (3) ( ) () () () () , , (81) (2,722) (100) (2,385) ,016 4,016 2,569 2, (205) (205) (464) (464) 50 (109) (109) (110) (110) 50 (4,016) (4,016) (2,569) (2,569) ,436 5, ,442 3, ,531 54, ,494 28, ,084 62, ,770 17, ,000 7,500 20,340 20, , ,
255 2. (3) ,270 13,674 8,689 6, , ,138 31,343 21,908 10, , ,739 35,494 16,669 1,859 85, ,974 38,422 21,621 4,575 86, ,478 50,759 11, , ,130 75,217 14,471 4, , , ,864 49,412 3, ,260 88,513 63,724 2,044 1, , , , ,856 32,396 1,390, ,027 5,331 2,707 4,951 93, ,776 23,486 6,177 5, , ,606 44,911 10, , ,930 32,157 13, , ,460 32,331 12, , ,310 48,612 13, , , ,658 35, ,729 51,476 72,584 1,109 2, , , ,070 94,525 15,523 1,130,
256 % %) A 97.65% %) AA A % %)
257 ,139 38,096 30,306 28,737 26,989 26,688 23,912 21,933 21,805 20,466 18, , , ,193 31,901 27,841 27,727 27,719 22,070 22,066 20,810 19,206 17,439 14, , ,
258 (2) (5) , ,543 45, , , ,205 28, ,158 1,564 31,302 6, ,549 37, ,484 1,020,327 8,445 8,722 27,027 44,194 10,716 1,075, ,165 5,043 6,026 26,687 37,756 5, , ,162 3,402 2, ,438 5, ,315 1,403,267 8,927 9,318 27,579 45,824 13,094 1,462,
259 , ,965 27, , , ,115 22, ,054 1,384 24,537 5, , , ,941 12, , ,323 5,602 3,930 9,527 19,059 7, , ,418 2,791 2,552 9,316 14,659 4, , ,905 2,811 1, ,400 2, ,108 1,288,576 5,804 6,797 10,203 22,804 9,769 1,321, , , , , ,305 2,
260 ,882 39,434 9,118 8, , ,011 2,236 2,236 28,860 16, , ,857 10,677 14,943 3,264 19,090 54, ,259 42,072 69,941 2, ,613 2,143 10,088 8,758 9, , ,559 8,392 3,154 15, , ,520 7,268 15,353 15,869 38,490 2,693 21,336 13,879 37,908 7, , , , ,525 1,208,151 5,677 70, ,257 3, ,268 9,760 8,489 37,831 86,963 73, , ,319 22,849 64, , ,467 1,200, , , , , , ,729 11,393 13,262 4,967 9,272 8,797 3,798 26, , , ,475 1,231,604 1,123, ,601 4,512,
261 ,066 11,668 14,923 27,657 2, ,764 55, ,774 68,857 11, ,854 9,154 6,013 15,167 3,408 1,435 4,843 97,150 2,827 99, , , , ,972 1,562,978 14,408 14, ,887 4,725 4,725 1,400 6, ,746 27,737 27,737 28,673 28,673 11,818 35, , , ,443 1,112 2,790 24,731 15,123 43,756 20,298 12,342 27,486 54, ,575 14,503 15,442 21,449 19,175 70, , , , , ,623 2,899,759 2 (35) , ,077 4, ,155 (273,326) (208,911) (3,463) (327) (486,027) 7,368 22, ,
262 ,548 39,357 10,563 1, , ,906 1,554 1, ,538 4, , ,327 6,684 2, ,740 31,008 5, ,048 67,667 98, ,302 1,812 9,851 5,966 6, , ,404 2,267 3, ,166 2,989 4, , ,756 14,518 26, ,824 9, ,985 9, , , , , ,820 8,730 11, ,612 12, ,443 3,774 9,344 12,175 64,973 65, , ,595 11,718 55, , ,109 1,154,365 1,551 82,164 78,077 76,364 90, , ,415 13,046 6,766 1,058 8,809 1, , , , ,383 1,069,994 1,093, ,222 3,851,
263 ,240 8,494 10,734 1, ,274 30, , ,123 18, ,951 19,399 6,448 25,847 3,692 3, ,154 5, , , , , , ,226,578 10,083 10, ,924 2,927 3,495 3,495 4,243 6,020 2, ,303 22,503 22,503 25,232 25,232 9,849 28, , , , ,863 18,128 6,027 30, ,572 31,496 31,207 70,325 5,920 3,196 7,458 3, , , , , , ,722 2,499, , ,358 2, ,009 (187,634) (268,505) (2,287) (458,426) , ,
264 , ,721 31,018 12, , , ,616 54,901 3, ,
265 , , % 264, , % 107,231 48, % 70,256 40, % 30,243 18, % 24,714 14, % % 8.56% 8.64% 8.56% 10.86% 9.90% 261
266 , ,047, , , , , , ,283 65,283 36,376 1,300, , , , ,036 40,686 40, , ,151 35, ,657 52,657 22, , , ,
267 1. (1) (i) (ii) (iii) (iv) (v) (2) 19 (3) 5% (%) % 5.41% % 263
268 (1) ) (2) (3)
269 2. (4) ,782 ) 3,375 2,013 ) 3,300 1,000 3,981 3,000 1, ,987 5,987 2, ) 480 ) )
270 (4) ) )
271 2. (5) , (6) ,199 8,178 7,663 21,901 7,514 2,813 2,
272 , ,420 89,280 72, ,190 84, ,842 95, , ,140 1,067, , ,147 6,900 1,043 3,975 10,190 10, ,218 3, ,647 2, ,722 2, ,380 5,036 16,967 13,
273 , ,583 86,131 39,472 70,011 49, , ,343 47,426 52, , , , , , , A ,950,813 A ,209 4, ,214 4,
274 ,613 8,888 6,613 8, ,500 5,000 6, , ,719 1,669 1,000 16,133 2,115 1, ,979 2,065 16,133 2, ,
275 ,676 33,676 5,987 16,983 3,981 20,964 9,191 9,191 61,208 61, ,000 3,892 2,685 1,000 3, ,300 4,206 2,250 3,375 5, ,746 14, ,402 7, ,895 14, ,556 7, ,676 33,676 5,987 16,983 16,983 2,030 9,191 9,191 46,426 14,782 61, ,685 2, ,013 2, ,045 17, ,746 8, (4) ,045 17,854 (4) 128,895 8,
276 (202) (24) (5) (231) (1) ,232 8, (4) (23) (1) 8,909 9,
277 ,214 8,632 25% 1,804 2, (1,941) (2,174) (194) (34) (54) (7) 235 (61) 273
278 (1) ,214 8, , (8,909) (9,344) (96) (4) (1,774) (202) 1, (88) (368) (2) ,214 4,159 (4,159) (8,858) ,486 (13,486) (3,115) 9,218 5,
279 ,279 28, (22) (282) (191) ,294 28,344 (79) 4 39,215 28,348 [2008] ,279 28,154 39,279 28, , , , ,
280 % 16.40% 18.22% 16.50%
281 H A H
282
283 H H
284 A
285 H H H
286 H
287 H H H
288 H H
289 H H H H H H
290 H
291 Ping An Insurance (Group) Company of China, Ltd. Ping An of China A H A A H 2318 A 樑 [email protected] [email protected] A H M The Bank of New York Mellon (
292
293
294
二 零 一 五 年 年 報
 香 港 交 易 及 結 算 所 有 限 公 司 及 香 港 聯 合 交 易 所 有 限 公 司 對 本 公 告 的 內 容 概 不 負 責, 對 其 準 確 性 或 完 整 性 亦 不 發 表 任 何 聲 明, 並 明 確 表 示, 概 不 對 因 本 公 告 全 部 或 任 何 部 份 內 容 而 產 生 或 因 倚 賴 該 等 內 容 而 引 致 的 任 何 損 失 承 擔 任 何 責 任 海
 二零一七年中期報告 1 2 4 6 8 11 11 14 18 22 24 28 32 34 36 42 64 65 68 70 72 74 75 76 77 78 135 136 44 54 56 2017 8 172017 17 17 18,280,241,4102017 6 306 0.5091.40 2010 5 2011 7 2012 7 27 2011 7 2011 7 2012 6 12
untitled
 1949 10 2016500 119 02328 68.98% 75.0% 80.0% 95.45% 100% 100% 100% 2 3 25 42 43 81 2016 6 30 2015 12 31 (%) 902,276 843,468 7.0 738,847 686,273 7.7 163,429 157,195 4.0 (1) 2.85 2.74 4.2 6 30 6 2016 2015
 CHINA MERCHANTS BANK CO., LTD. 03968 2010 2010 12 31 2010 2010 2011 4 H www.hkex.com.hk www.cmbchina.com www.cmbchina.com www.hkex.com.hk www.cmbchina.comwww.sse.com.cn 2011 3 31 2 3 8 12 16 22 88 97 113
 2 3 4 7 8 25 25 27 29 32 1313.22 33 34 34 35 35 35 35 36 37 38 40 41 42 44 45 84 1 China COSCO Holdings Company Limited China COSCO 1 3 300461 183 49 CEO ** * ** * ** H A H 1919 A 601919 H 183 18 1806-1807
untitled
 : 2628 2 3 6 7 10 29 36 39 50 54 70 92 96 97 98 100 102 104 105 107 217 1 1 1 2 China Life Insurance Company LimitedChina Life 16 86-10-63631244 86-10-66575112 [email protected] 16 86-10-63631068 86-10-66575112
 股份代碼 : 601318 二零一一年年報 二零一一年年報 2012 3 152011 18 162 i i 1 2 4 6 10 11 22 24 24 30 42 48 54 56 62 64 70 74 130 131 134 136 137 139 140 141 142 143 277 279 285 287 288 76 82 96 113 117 121 1 7,000 194.7512.5%
目 錄 第 一 節 重 要 提 示 和 釋 義 2 第 二 節 公 司 簡 介 4 第 三 節 會 計 數 據 和 財 務 指 標 摘 要 7 第 四 節 董 事 會 報 告 10 第 五 節 重 要 事 項 40 第 六 節 股 本 變 動 及 股 東 情 況 43 第 七 節 優 先 股 相 關
 香 港 交 易 及 結 算 所 有 限 公 司 及 香 港 聯 合 交 易 所 有 限 公 司 對 本 公 告 的 內 容 概 不 負 責, 對 其 準 確 性 或 完 整 性 亦 不 發 表 任 何 聲 明, 併 表 明 概 不 對 因 本 公 告 全 部 或 任 何 部 份 內 容 而 產 生 或 因 倚 賴 該 等 內 容 而 引 致 的 任 何 損 失 承 擔 任 何 責 任 中 國 光 大
2 5 8 9 28 33 38 41 61 92 93 94 96 98 100 101 103 105 210
 235,470,000 *ST 2 5 8 9 28 33 38 41 61 92 93 94 96 98 100 101 103 105 210 China COSCO Holdings Company Limited China COSCO 12 12 (022) 66270898 (022) 66270898 (022) 66270899 (022) 66270899 [email protected]
AR C_Longyuan_.pdf
 ( 於中華人民共和國註冊成立的股份有限公司 ) 股份代號 00916 2 015 年度 報 告 僅供識別 2015 年度報告 僅供識別 ... 2... 4... 8... 14... 22 2015... 24... 26... 66... 83... 94... 110... 115... 119... 140... 143... 145... 147... 150... 152... 155...
2013 10 1.50 2
 6030 2013 2013 12 31 2013 2013 2014 4 30 H http://www.hkexnews.hk http://www.cs.ecitic.com 1 2013 10 1.50 2 ... 4... 7... 8... 17... 20... 22... 52... 59... 71... 80... 92... 123... 214... 215.... 216....
2015 10 5.00 2
 6030 2015 2015 12 31 2015 2015 2016 4 30 H http://www.hkexnews.hk http://www.cs.ecitic.com 1 2015 10 5.00 2 ... 4... 7... 8... 18... 22... 23... 65... 72... 92... 103... 117... 150... 228... 229... 230...
... 1... 3... 3... 4... 6... 7... 7... 7... 8
 GOME ELECTRICAL APPLIANCES HOLDING LIMITED * 493 * ... 1... 3... 3... 4... 6... 7... 7... 7... 8 493 3,600,000,000 57 0.0 % GOME ELECTRICAL APPLIANCES HOLDING LIMITED * 493 Canon s Court 22 Victoria Street
 WORLD-CLASS Hospitality WITH Eastern Charm ANNUAL REPORT 2013 (A joint stock limited company incorporated in the People s Republic of China with limited liability) Stock Code 00670 2 4 5 6 8 10 12 18
409918 (Minshing A share).indb
.indb") 600016 2011 2012 3 22 181815 33 2011 2 4 6 8 12 46 54 64 90 91 99 102 104 107 110 111 113 230 236 237 240 2011 1 2 2011 279.2058.81% 1.40%0.3123.95%5.66 0.63% 0.06 357.29% 86.842.23%0.35 20062009 2010
600016 2011 2012 3 22 181815 33 2011 2 4 6 8 12 46 54 64 90 91 99 102 104 107 110 111 113 230 236 237 240 2011 1 2 2011 279.2058.81% 1.40%0.3123.95%5.66 0.63% 0.06 357.29% 86.842.23%0.35 20062009 2010
476651 (Citic Securities) RA Chi.indb
 RA Chi.indb") 6030 2012 2012 12 31 2012 2012 2013 4 30 H http://www.hkexnews.hkhttp://www.cs.ecitic.com 1 2012 103.00 2 ............................................................................................ 4...................................................................................
6030 2012 2012 12 31 2012 2012 2013 4 30 H http://www.hkexnews.hkhttp://www.cs.ecitic.com 1 2012 103.00 2 ............................................................................................ 4...................................................................................
 二 零 一 五 年 中 期 報 告 1 2 3 4 6 10 10 13 26 30 36 39 42 65 66 69 71 72 74 75 76 77 78 132 136 44 52 54 2015 8 20 2015 17 152 18,280,241,4102015 6 0.183,290,443,453.80 2010 5 2011 7 2012 7 27 1 9,000 346.49
untitled
 2008 2 2008 1 1 2008 12 31 A 1.00 H 1.00 3 5 7 10 17 26 33 36 45 56 58 2008 66 71 72 153 155 267 2008 268 4 ANHUI CONCH CEMENT COMPANY LIMITED ACC 0086 553 8398918 0086 553 8398931 00852 2111 3220 00852
65425_Chi.indb
 : 3328 1908 2005620075 10529769 1662,6368 20081,00066 54 ISMS ISO27001 2010 2 4 8 16 23 64 70 85 92 98 114 117 121 123 129 284 298 300 308 80,000 30,000 28,393 3,000,000 2,682,947 70,000 65,862 25,000
2 2.1 A H A 2
 CHINA RAILWAY GROUP LIMITED 390 1 1 2 2.1 A H 601390 00390 1 100070 www.crec.cn [email protected] 2.2 100039 86-10-5187 8413 86-10-5187 8417 [email protected] 69 A 2 3 3.1 3.1.1 2010 6 30 6 2009 2010 2009 2008 2007
3 4 7 18 24 79 85 98 99 145 169 176 177 178
 2014 年 度 報 告 3 4 7 18 24 79 85 98 99 145 169 176 177 178 13 12 AH102.5 2015 2 92015 2015AH HH 1,916,978,820H H HAH 11,501,700,0002,875,425,000.00H 479,244,705.0010,369,758,976.60 2 2014 IT FICC Banco Espírito
(Chi).indb
.indb") 中國銀行股份有限公司 H 股 股 份 代 號 3988 2011 年 年 度 報 告 2012 年 4 月 本 行 2011 年 年 度 報 告 之 印 刷 版 本 將 取 代 此 版 本 3 4 6 7 9 11 13 14 14 34 52 63 66 67 68 75 90 108 115 120 124 126 372 377 378 382 383 390 1 1912 2 19121949
中國銀行股份有限公司 H 股 股 份 代 號 3988 2011 年 年 度 報 告 2012 年 4 月 本 行 2011 年 年 度 報 告 之 印 刷 版 本 將 取 代 此 版 本 3 4 6 7 9 11 13 14 14 34 52 63 66 67 68 75 90 108 115 120 124 126 372 377 378 382 383 390 1 1912 2 19121949
2
 6030 2 0 1 5 2015 6 30 6 2015 2015 http://www.hkexnews.hk http://www.cs.ecitic.com 1 2 ... 4... 7... 11... 13... 33... 37... 51... 56... 57... 58... 104... 105... 109 3 4 2013 2013 CITIC Securities Finance
中 國 銀 行 全 球 網 絡 1929 31
 追 求 卓 越 持 續 增 長 2010 年 年 度 報 告 中 國 銀 行 股 份 有 限 公 司 ( 於 中 華 人 民 共 和 國 註 冊 成 立 的 股 份 有 限 公 司 ) 股 票 代 碼 :601988 中 國 銀 行 全 球 網 絡 1929 31 1912 2 1912 1949 1994 2003 2004 8 2006 6 7 31 年 報 目 錄 1 2 3 5 6 7 11
untitled
 :06881 2015 12 31 2015 12 31 2015 2015 20164www.hkexnews.hk www.chinastock.com.cn 2016 3 28 2 5 6 7 8 43 49 90 104 111 114 133 159 160 2015 1 A bp 1bp 11% 2007126 H06881 1.00 20151231 ETF IB 100% 70%30%
China International Capital Corporation Limited XIVA A ,832,853,595 2,720,718,
 China International Capital Corporation Limited 3908 13.09 571 XIVA A 2018 9 30 2018 9 30 2018 1 1 2018 9 30 9,832,853,595 2,720,718,630 2017 4 1 2018 1 1 2018 9 302017 1 1 2017 9 30 2017 4 1 2017 9 30
 6837 2016 12 31 2016 12 31 2016 (www.hkexnews.hk) (www.htsec.com) H2016 2017 3 29 * 3 7 23 28 62 91 100 101 149 184 193 194 195 13 11 2016 12 31AH11,501,700,000 AH 10 2.20 2,530,374,000.00 16,131,942,148.54
672183 (BOC_A Share)_.indb
_.indb") 601988 2013 1929 37 1912 2 19121949 1949 1994 2004 8 2006 67A+H 2013 3 37 1 2013 2013 2 4 5 6 7 10 11 13 17 19 19 35 50 58 60 61 64 70 85 95 98 100 103 104 106 280 283 284 3 2013 2013 4 / / A 571 / (BVI)
601988 2013 1929 37 1912 2 19121949 1949 1994 2004 8 2006 67A+H 2013 3 37 1 2013 2013 2 4 5 6 7 10 11 13 17 19 19 35 50 58 60 61 64 70 85 95 98 100 103 104 106 280 283 284 3 2013 2013 4 / / A 571 / (BVI)
2015 A
 招商銀行股份有限公司 股票代碼 :600036 2015 年度報告 招商銀行 因您而變 2015 A 1 2 3 3 4 11 15 19 23 23 5.1 24 5.2 34 5.3 44 5.4 50 5.5 53 5.6 55 5.7 56 5.8 59 5.9 65 5.10 77 5.11 83 5.12 84 5.13 85 96 104 121 139 140 141 2 2015
 6837 2017 12 31 2017 12 31 2017 2017 12 31 (www.hkexnews.hk) (www.htsec.com) H2017 2018 3 27 * 3 7 23 29 74 104 114 115 164 200 210 211 212 1 13 11 2017 12 31AH11,501,700,000 AH102.30 2,645,391,000.0017,817,845,957.76
 ( 於中華人民共和國註冊成立的股份有限公司 ) 股 份代號 3606 (A joint stock limited company incorporated in the People's Republic of China with limited liability) Stock Code: 3606 2016 2016 中期報告 Interim Report 2016 中期報告 Interim
二零零八年年報
 Ping An Insurance (Group) Company of China, Ltd. 2318 13.09(2) 2008 2009 4 8 Clive Bannister 1 二零零八年年報 1 4 8 9 20 25 30 42 46 47 85 87 98 99 100 2009 4 82008 19172 甦 1 2009 1 2 Fortis SA/NV Fortis N.V.
165321(H share CHI) (insert cover).indb
 (insert cover).indb") 2 2 1908 2005 6 2007 5 128307 90 220 2,643 11 2010 1,00049 50 5046 2 4 6 8 14 20 53 58 70 77 83 96 98 101 103 109 231 240 248 2 0 20,000 40,000 60,000 80,000 100,000 84,995 53,943 65,862 66,668 39,497
2 2 1908 2005 6 2007 5 128307 90 220 2,643 11 2010 1,00049 50 5046 2 4 6 8 14 20 53 58 70 77 83 96 98 101 103 109 231 240 248 2 0 20,000 40,000 60,000 80,000 100,000 84,995 53,943 65,862 66,668 39,497
678859(ABC AR_Chi)_.indb
_.indb") 195170 2009 1 2010 7 2013145,621.02 118,114.11 72,247.1311.86%1.22%1,662.11 23,547 337 3513,506 19,64873 12 93 2013 50064 1,0002012102013 A/A-1A1/P-1 A/F1 2 4 6 10 12 15 19 19 21 22 44 64 68 87 89 95 110
195170 2009 1 2010 7 2013145,621.02 118,114.11 72,247.1311.86%1.22%1,662.11 23,547 337 3513,506 19,64873 12 93 2013 50064 1,0002012102013 A/A-1A1/P-1 A/F1 2 4 6 10 12 15 19 19 21 22 44 64 68 87 89 95 110
2015 3 30 17 11 1 1 2014 10 1.10 2014
 2014 2015 3 30 17 11 1 1 2014 10 1.10 2014 2 5 6 13 14 16 18 20 92 106 132 182 183 189 195 200 204 209 414 415 416 420 2 A A 2014 3 IT 4 571 2014 5 6 2014 7 2014 2014 2014445.46 5.36%1.26%20.35% 1.310.07
中 国 外 运 股 份 有 限 公 司 ( 住 所 : 北 京 市 海 淀 区 西 直 门 北 大 街 甲 43 号 金 运 大 厦 A 座 ) 公 开 发 行 2016 年 公 司 债 券 ( 第 一 期 ) 募 集 说 明 书 ( 面 向 合 格 投 资 者 ) 牵 头 主 承 销 商 / 债
 公 开 发 行 2016 年 公 司 债 券 ( 第 一 期 ) 募 集 说 明 书 ( 面 向 合 格 投 资 者 ) 牵 头 主 承 销 商 / 债") 香 港 交 易 及 結 算 所 有 限 公 司 及 香 港 聯 合 交 易 所 有 限 公 司 對 本 公 佈 的 內 容 概 不 負 責, 對 其 準 確 性 或 完 整 性 亦 不 發 表 任 何 聲 明, 並 明 確 表 示, 概 不 對 因 本 公 告 全 部 或 任 何 部 分 內 容 而 產 生 或 因 倚 賴 該 等 內 容 而 引 致 之 任 何 損 失 承 擔 任 何 責 任 (
香 港 交 易 及 結 算 所 有 限 公 司 及 香 港 聯 合 交 易 所 有 限 公 司 對 本 公 佈 的 內 容 概 不 負 責, 對 其 準 確 性 或 完 整 性 亦 不 發 表 任 何 聲 明, 並 明 確 表 示, 概 不 對 因 本 公 告 全 部 或 任 何 部 分 內 容 而 產 生 或 因 倚 賴 該 等 內 容 而 引 致 之 任 何 損 失 承 擔 任 何 責 任 (
A H 1398 A % 20,150,956 18,917, ,
 1398 2014 9 30 13.09 1. 1.1 1.2 2014 10 29 2014 1.3 1.4 1 2. 2.1 A 601398 H 1398 A 113002 55 100140 86-10-66108608 86-10-66107571 [email protected] 2.2 2.2.1 2014 9 30 2013 12 31 % 20,150,956 18,917,752 6.52
 2013 10 1.50 2 5 6 16 20 22 62 65 80 88 106 141 290 291 292 298 299 2013 12 24 2 2013 CLSA BV 2013 7 31 2013 12 2 2013 2013 CASA BV Crédit Agricole Securities Asia BV 3 A 1.00 600030 H 1.00 6030 A A H
65499.indb
 Bank of Communications Co., Ltd. 3328 13.09(2) 2008 2009 3 18 * * * * * * * * # Ian Ramsay Wilson # Thomas Joseph Manning # # # # * # : 601328 1908 2005 6 2007 5 105 297 69 166 2,6368 20081,00066 54 (ISMS)
(chi) H_.indb
 H_.indb") 2012 19841120051028 20061027 39 17,1253831,771 4383.93 2 3 5 7 10 13 17 17 22 39 63 82 84 86 88 92 94 102 114 133 136 141 145 148 150 2012 293 297 HIBOR Hong Kong Interbank Offered Rate LIBOR London Interbank
2012 19841120051028 20061027 39 17,1253831,771 4383.93 2 3 5 7 10 13 17 17 22 39 63 82 84 86 88 92 94 102 114 133 136 141 145 148 150 2012 293 297 HIBOR Hong Kong Interbank Offered Rate LIBOR London Interbank
 6837 2015 12 31 2015 12 31 2015 (www.hkexnews.hk) (www.htsec.com) H2015 2016 3 30 * 3 8 23 28 62 84 92 93 129 160 170 171 172 13 11 2015 12 31AH11,501,700,000AH 104.505,175,765,000.00 14,655,043,372.86
untitled
 * 06830 20,000,000 (a) 1.400 28.00 2012/01/12 40,000,000 (b) 1.400 56.00 1.1 140,000,000 (b) 1.400 196.00 01303 18,492,000 (a) 1.700 31.44 2012/01/12 231,508,000 (b) 1.700 393.56 0.74 01281 3,676,000 (a)
 2 4 5 9 11 14 32 40 67 69 82 83 85 86 87 89 90 200 1 306 72 89 51.3% 24115 32,791,713 1,250,609 11.9% 139399,237 40 120 74 12 1752 2 51% 49% 29 400 16.23% 50% 3 4 1 3 300461 183 49 CEO ** * ** * ** H 183
untitled
 * 01385 # H n.a. n.a. n.a. 2014/01/08 + n.a. n.a. 01353 H 15,000,000 (a) 2.13 31.95 2014/01/09 145,794,000 (b) 2.13 310.54 1.04 01439 100,000,000 (a) 0.51 51.00 2014/01/13 100,000,000 (b) 0.51 51.00 294.50
(02) (02) (02) (02) A (03) (03) (04)
 (02) (02) (02) A (03) (03) (04)") JF ( JF ) JF ( JF ) 3~4 ( ) ( ) ( ) ( ) ( ) ( ) 12 15 16 17 ( ) ( h t t p :// m o p s. t w s e. c o m. t w (http://www.jpmrich.com.tw) www.jpmrich.com.tw 65 17 (02) 2755-8686 (02) 2702-4699 285 25 (02)
JF ( JF ) JF ( JF ) 3~4 ( ) ( ) ( ) ( ) ( ) ( ) 12 15 16 17 ( ) ( h t t p :// m o p s. t w s e. c o m. t w (http://www.jpmrich.com.tw) www.jpmrich.com.tw 65 17 (02) 2755-8686 (02) 2702-4699 285 25 (02)
( 於開曼群島註冊成立的有限公司 ) ( 股份代號 : 1880)
 ( 股份代號 : 1880)") ( 於開曼群島註冊成立的有限公司 ) ( 股份代號 : 1880) I 2-3 II 4 III 5 IV CEO 6-15 V 16-19 VI 20-29 VII 30-34 VIII 35-37 IX 38-39 X 40 XI 41-42 XII 43 XIII 44 XIV 45 XV 46-110 , FCPA Offshore Incorporation (Cayman) Limited
( 於開曼群島註冊成立的有限公司 ) ( 股份代號 : 1880) I 2-3 II 4 III 5 IV CEO 6-15 V 16-19 VI 20-29 VII 30-34 VIII 35-37 IX 38-39 X 40 XI 41-42 XII 43 XIII 44 XIV 45 XV 46-110 , FCPA Offshore Incorporation (Cayman) Limited
書冊C_ indb
 38D 1933 0440 36.89 32,533,8312.00 8 1 8 10 (i)(ii) (iii) (i)(ii) (iii) i 6D 6D 6D 6D 6D 708 707 6D 6D ii Capital Markets and Services Act 2007 CMSA CMSA 229(1)(b) 230(1)(b) 6 7 iii CMSA 5 Securities Act
BOC H share (Chi)_(insert cover).indb
_(insert cover).indb") 2015 :3988 :4601 1929 46 1912 2 19121949 1949 1994 2004 8 2006 67A+H 2015 5 46 1 2015 2015 2 4 5 6 7 10 11 13 15 17 17 32 48 56 58 59 61 68 84 95 100 102 104 106 263 267 268 269 271 273 275 3 2015 2015
2015 :3988 :4601 1929 46 1912 2 19121949 1949 1994 2004 8 2006 67A+H 2015 5 46 1 2015 2015 2 4 5 6 7 10 11 13 15 17 17 32 48 56 58 59 61 68 84 95 100 102 104 106 263 267 268 269 271 273 275 3 2015 2015
XIAOMI CORPORATION 小米集團 2,179,585,000 1,434,440,000 B 745,145, ,980,000 2,070,605,000 1,325,460,000 B 745,145, % % 0.005%
 小米集團 2018 6 25 1933 (a) (b) (c) 30 571 30 1 XIAOMI CORPORATION 小米集團 2,179,585,000 1,434,440,000 B 745,145,000 108,980,000 2,070,605,000 1,325,460,000 B 745,145,000 17.00 1% 0.0027% 0.005% 0.0000025 1810
 懂感恩 助未來 二 零 一 八 年 中 報 1 2 4 6 8 11 14 14 21 28 34 38 43 47 50 58 89 90 93 95 97 99 100 101 102 103 179 180 62 75 77 2018 8 212018 15 15 18,280,241,4102018 6 306 0.62 11,333,749,674.20 2010 5 2011 7 2012